Experiments, labelled as experiments.
Everything here is built on the same public APIs you can use. That is the point: if an experiment looks interesting, the endpoints behind it are documented and available.
These are not products. They are not supported, some are unfinished, and any of them may change or disappear. When something here becomes good enough to rely on, it moves into the product and leaves this page.
Live captures from the demos below · © OpenStreetMap contributors
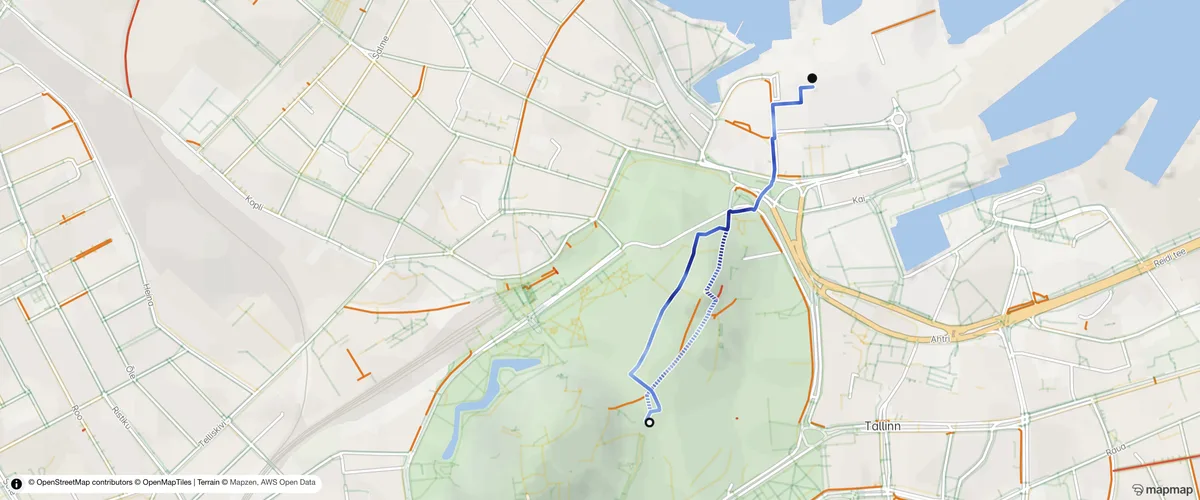
Tallinn surface quality
ExperimentEvery path and road in Tallinn that anyone has rated for surface condition, 15,444 ways and 985 km of them, coloured from excellent to impassable. Filter to the 683 ways that are bad or worse for a wheel, or to the 125 rated from Bolt scooter accelerometer traces in a reviewed pilot batch, and tap any line for its tags and its OpenStreetMap page. Then pick a wheelchair journey and watch two copies of the same routing engine answer it: one reads the surface quality, one ignores it, with the extra distance and the bad surface avoided written out for each. On some journeys they agree, and the page says so. Recolour the city by steepness, or turn on 3D terrain, and the hills the routes contend with become visible; every journey carries its climb and an elevation profile for both answers. Neither route is a claim that the way is accessible: kerbs, widths and steps are outside this comparison, and climb is shown rather than routed on.
Known limit Smoothness is a mapper's subjective judgement, not a measured roughness index, and coverage is uneven across the city. An unrated way is missing data, never evidence of a good surface, so the map shows where ratings exist rather than the true state of every street.
Built with
- Global vector basemap from our own tiles API, the same planet archive behind /map
- Surface ratings are the OpenStreetMap smoothness tag, fetched once from Overpass and baked to static GeoJSON at build time
- Steepness, climb and the 3D terrain view come from a 30 metre open terrain model, the same dataset behind our /elevation endpoint
- The page ships no live computation: it fetches static files and paints them
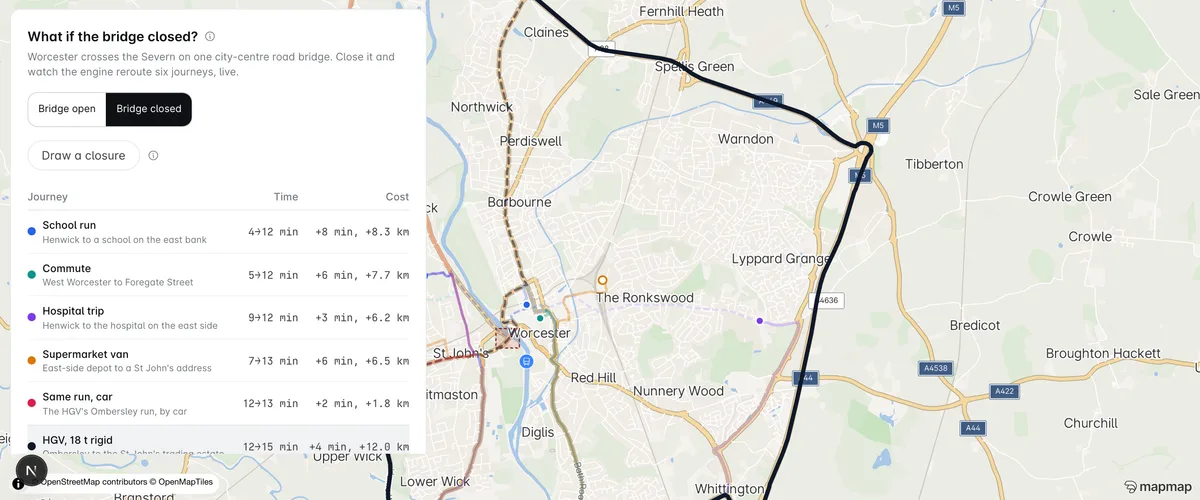
What if the bridge closed?
ExperimentWorcester crosses the Severn on one city-centre road bridge. Flip a switch to close it and the routing engine recomputes six hypothetical journeys live, with a receipt of what each diversion costs: the school run goes from 4 minutes to 12, and the last two rows run the same Ombersley journey twice, where the car diverts 1.8 km over a crossing to the north and the 18 tonne HGV, which cannot follow it, diverts 12 km. Then draw your own closure anywhere on the map and watch the receipts update.
Known limit The closures are simulated: no road shown is actually closed and no real closure is implied. Journeys are hypothetical archetypes, times are free-flow engine estimates with no live traffic, and the receipt reports what the engine computes, not a prediction of what congestion would do around a real closure.
Built with
- Live routing from the public POST /route endpoint: each closure is one exclude_polygons ring, recomputed the moment you change the scenario
- The HGV row declares an 18 t rigid through truck costing, so its diversion can differ from the cars
- Nothing precomputed: every number on the receipt is the engine answering in real time
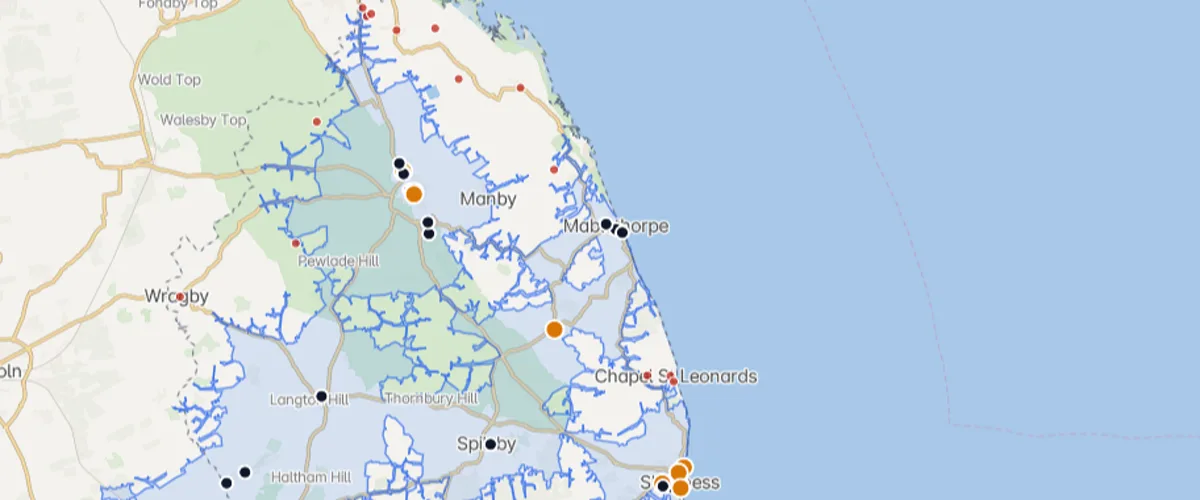
EV charging gap finder
ExperimentWhere can't you charge? Every public charge point in East Lindsey, Herefordshire and Stoke-on-Trent from open data, 5/10/15-minute drive-time coverage from our isochrone API, and the honest headline per council area: the share of residents inside, computed against Census 2021 population centroids. Toggle to rapid-only (50 kW+) and watch the map empty out. Built for the question every LEVI officer is asked.
Known limit Charge point registries contain stale and dead entries, and the snapshot understates the live network, so site counts are indicative rather than official. Coverage is measured at neighbourhood centroids, not every doorstep, and a 10-minute drive says nothing about whether the charger is free, working or affordable.
Built with
- Drive-time areas from the public /isochrone endpoint (one multi-contour call per charging site)
- Charge points from Open Charge Map (CC BY 4.0) carrying the archived National Chargepoint Registry (OGL v2.0); population from ONS Census 2021 (OGL)
- All precomputed to static JSON at build time: the page ships no live computation
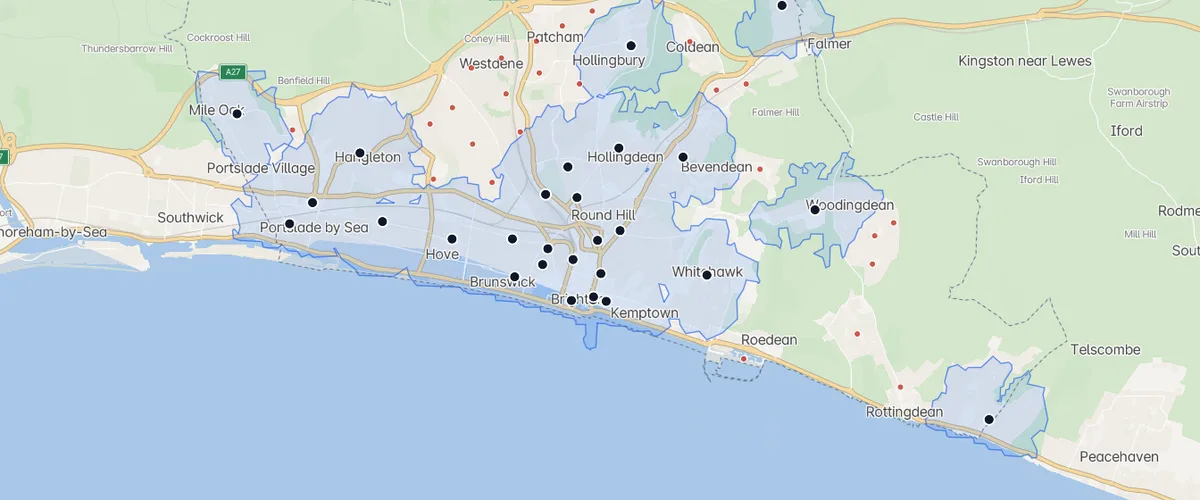
UK 15-minute access explorer
ExperimentHow much of Brighton & Hove, York and Cambridge can reach a GP surgery within 15 minutes? Every practice from NHS open data, 10/15/20-minute areas on foot, bike or car from our isochrone API, and the honest headline: the share of residents inside, computed against Census 2021 population centroids. Tap any practice for its own rings.
Known limit Practices are ODS practice organisations: a multi-site group counts once, at its main site, so branch surgeries are invisible and walking coverage reads lower than lived reality, York especially. Coverage is measured at neighbourhood centroids, not every doorstep.
Built with
- Travel-time areas from the public /isochrone endpoint (one multi-contour call per practice)
- GP practices from NHS ODS, population from ONS Census 2021 (Open Government Licence)
- All precomputed to static JSON at build time: the page ships no live computation
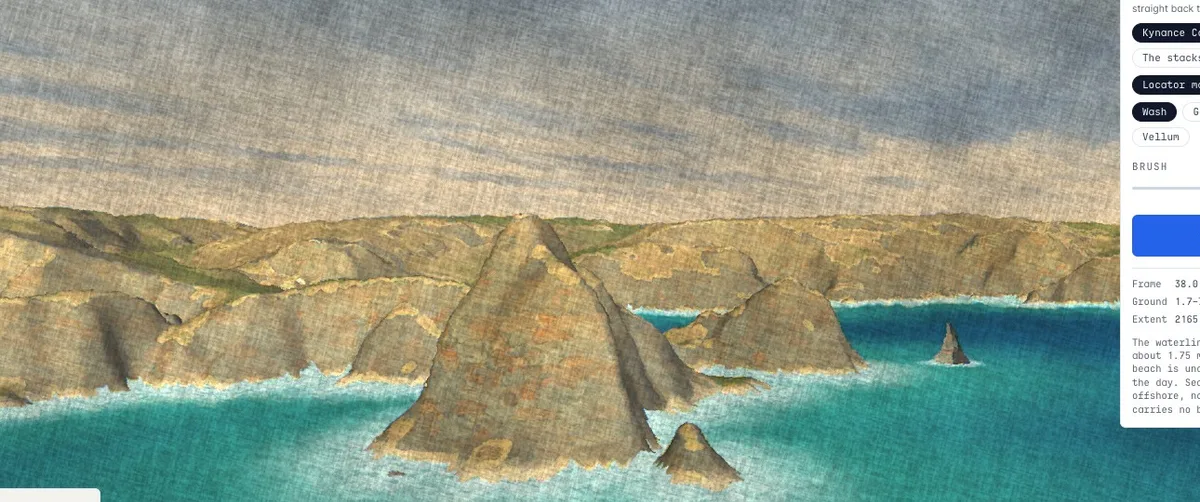
Painted coast
ExperimentKynance Cove rendered as a painting: real one-metre Environment Agency LIDAR relief, sea shaded by depth, and stylised rock built in Blender, all painted by a GPU brushwork pass rather than a texture.
Known limit The clifftop skyline is genuinely level, because the Lizard is level, and no camera inside this window fixes that. Rock texture tiles visibly on the largest cliff faces, and nothing casts a shadow across the ground yet.
Built with
- Terrain from EA LIDAR (Open Government Licence)
- Vector basemap from our own tiles API
- Rendered client-side in MapLibre with a custom WebGL layer
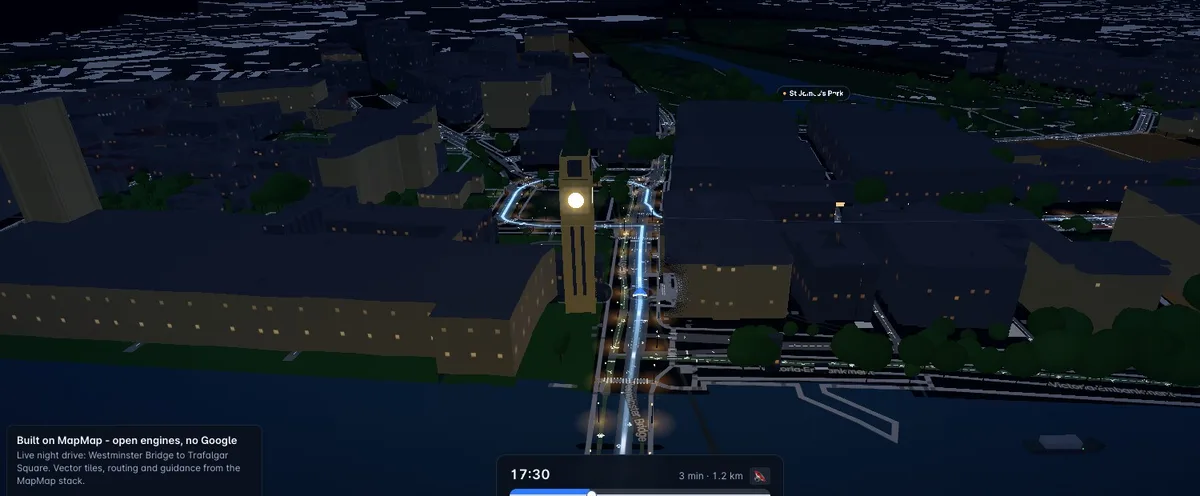
London in 3D, day and night
ExperimentA drive from Westminster Bridge to Trafalgar Square, four light presets that follow the real sun. Buildings dissolve when they block the road ahead so the route is never hidden, live TfL buses and Thames vessels move where they really are, and ?vehicle=truck swaps to a second baked line along Victoria Embankment. That pair is not a vehicle-restriction comparison: the two requests differ by a waypoint, not by costing. The Bermondsey to Limehouse corridor below is where a lorry genuinely diverges.
Known limit One scripted corridor, not a product: the rest of the planet still renders as the standard map. Grab the map mid-drive and it keeps navigating without you.
Built with
- Routing and turn-by-turn from the public /route endpoint
- Lane guidance from real Valhalla turn-lane data
- Building heights from EA LIDAR (Open Government Licence)
- Road and junction polygons baked offline with osm2streets
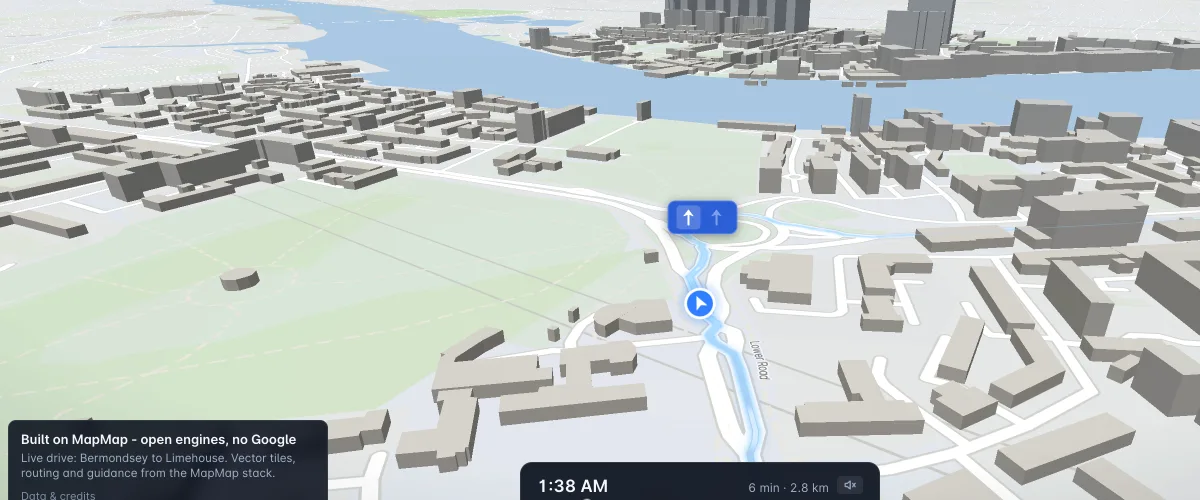
Under or over the Thames
ExperimentBermondsey to Limehouse, and the one London corridor where a routing difference is real. Same origin, same destination, no waypoints: the car goes under the river through the Rotherhithe Tunnel, 3.3 km in six and a half minutes. Add ?vehicle=truck and the identical request with an 18 tonne lorry declared is sent over Tower Bridge and along The Highway instead, 6.5 km and nearly six minutes more, because Transport for London bans goods vehicles over 2 tonnes from the tunnel. The restriction is named on the drive and sourced to TfL.
Known limit No street-level bake here: no facades, street life or live buses, and the buildings are the basemap's own extrusions. The engine's rationale cannot cite this diversion as a height or weight limit, because the tunnel ban is categorical rather than dimensional, so the page words it as the road ban it is.
Built with
- Both lines from the public /route endpoint: auto costing for the car, truck costing with 4.5 m and 18 t declared for the lorry
- The restriction is Transport for London's published Rotherhithe Tunnel rule (no goods vehicles over 2 t GVW), carried in OpenStreetMap as hgv=no on the tunnel ways
- Basemap only: buildings are the standard 3D extrusions from our own tiles API, no corridor bake

Manhattan in 3D, live
ExperimentColumbus Circle through Times Square to the Chrysler Building: real MTA buses where they actually are, and a tap on any bus overlays its real route. Towers at their true surveyed heights dissolve when they block the view of the road, and four light presets follow the real sun down the canyon.
Known limit Same scripted-corridor honesty as London: one drive, the rest of the planet renders as the standard map. Landmark models (the Chrysler crown deserves better than a box) are still to come.
Built with
- Routing and turn-by-turn from the public /route endpoint (it refused pedestrianised Broadway on its own)
- Live bus positions from MTA BusTime, snapped to the road network
- Building heights from OSM's NYC city-data import
- Road and junction polygons baked offline with osm2streets
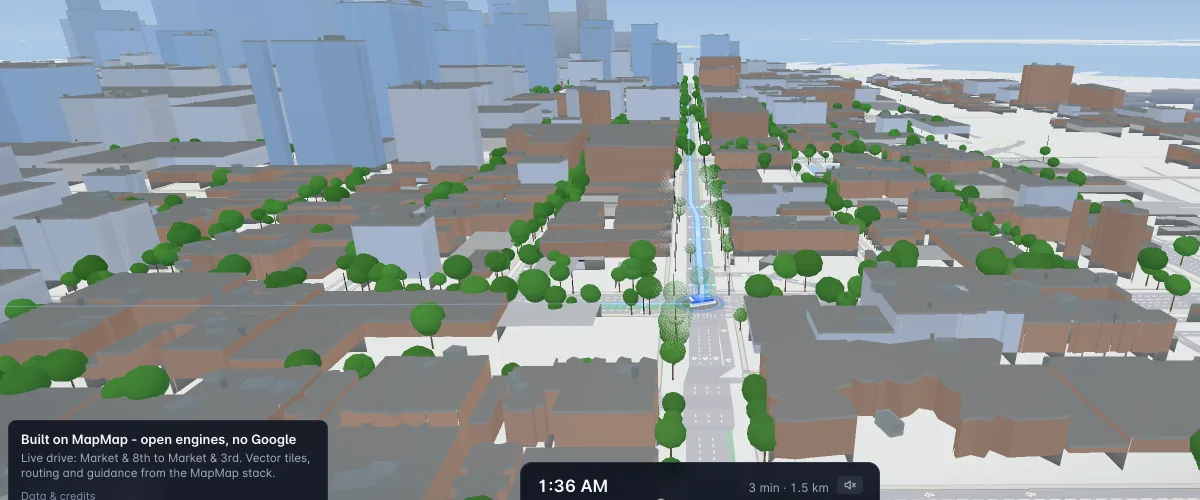
Market & 8th to Market & 3rd, the same two endpoints asked twice. The car line the engine returns contains zero metres of Market Street, where private cars have been banned since January 2020, while the bicycle line down the identical endpoints runs 763 m straight along it; the banned ways are drawn as a wall. ?corridor=sf-tunnel swaps to Union Square to Nob Hill, where a declared 4.1 m lorry is turned away from the Stockton Tunnel's signed 13 ft 0 in bore and sent over the hill on Powell Street, and the engine's own rationale names the height limit that did it. Buildings stand at DataSF lidar heights, street trees where DataSF records them, and four light presets follow the real sun.
Known limit Scripted corridors, not a product: the rest of the planet renders as the standard map. Market Street is not car-free: the ban is on private cars, with carve-outs for commercial plates and, since August 2025, Waymo and black-car rideshare, so the wall on screen is a diagram of a legal restriction, not anything built there. The lorry goes over Nob Hill because of height, not slope: hill avoidance changes nothing on this data.
Built with
- Routing and turn-by-turn from the public /route endpoint, with rationale: true naming the binding height constraint on the tunnel corridor
- Building heights from DataSF lidar and street trees from DataSF, both open data
- Road and junction polygons baked offline with osm2streets, exactly as for London
Where things live
- Playground and Studio are products: supported and documented.
- Built with MapMap is real, working apps built on our APIs.
- News and Changelog are what actually shipped.