Reachability analysis you can run, cite and publish.
Isochrones and OD matrices computed from open data, with the provenance stated on the page rather than buried in a methodology PDF. Export straight to kepler.gl, or host the whole stack.
Analysis that shows its working.
Both demos below are public, interactive and honest about their sources: the same endpoints are yours to script against with a card-free key.
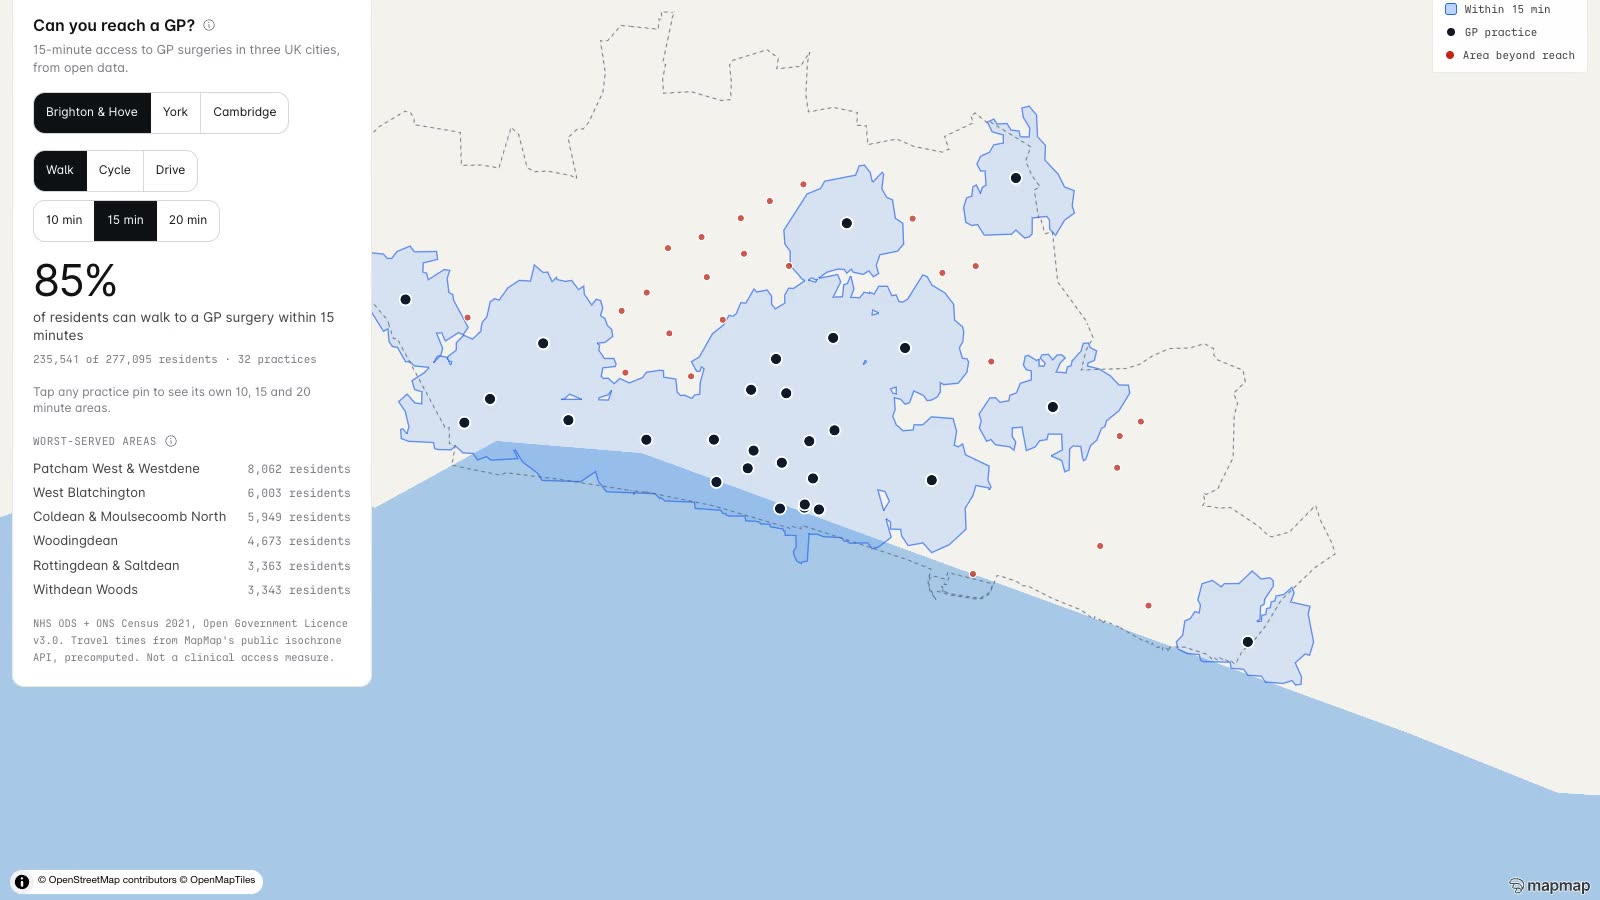
15-minute access to GP practices, mapped
How much of Brighton & Hove, York and Cambridge can reach a GP practice main site within 15 minutes on foot? Every practice from NHS ODS, every ring from the public isochrone endpoint, measured against Census 2021 population centroids.
Open the access explorer →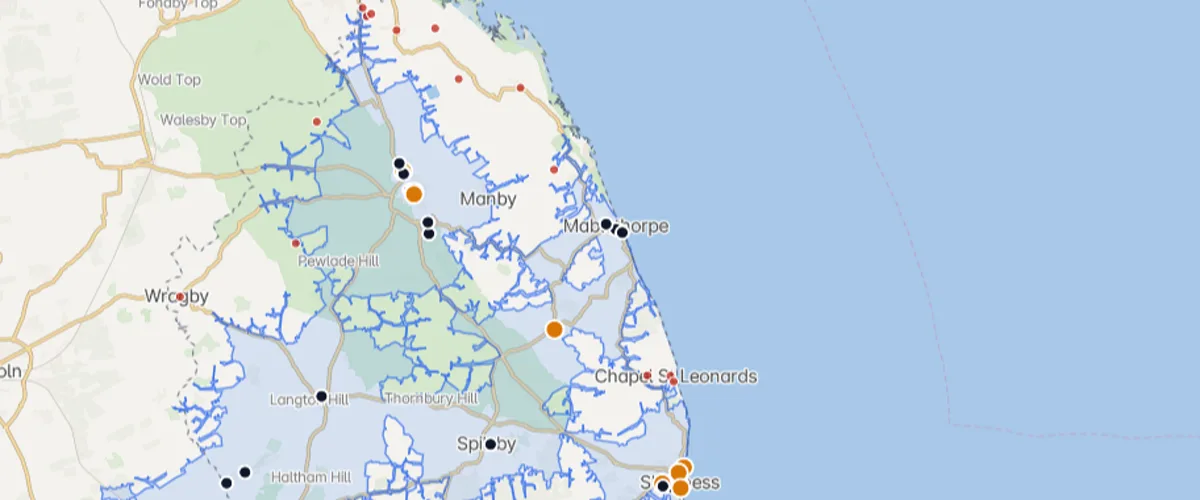
Where can't you charge an EV?
Drive-time coverage from every public charge point in East Lindsey, Herefordshire and Stoke-on-Trent, against the residents who fall outside it.
Open the gap finder →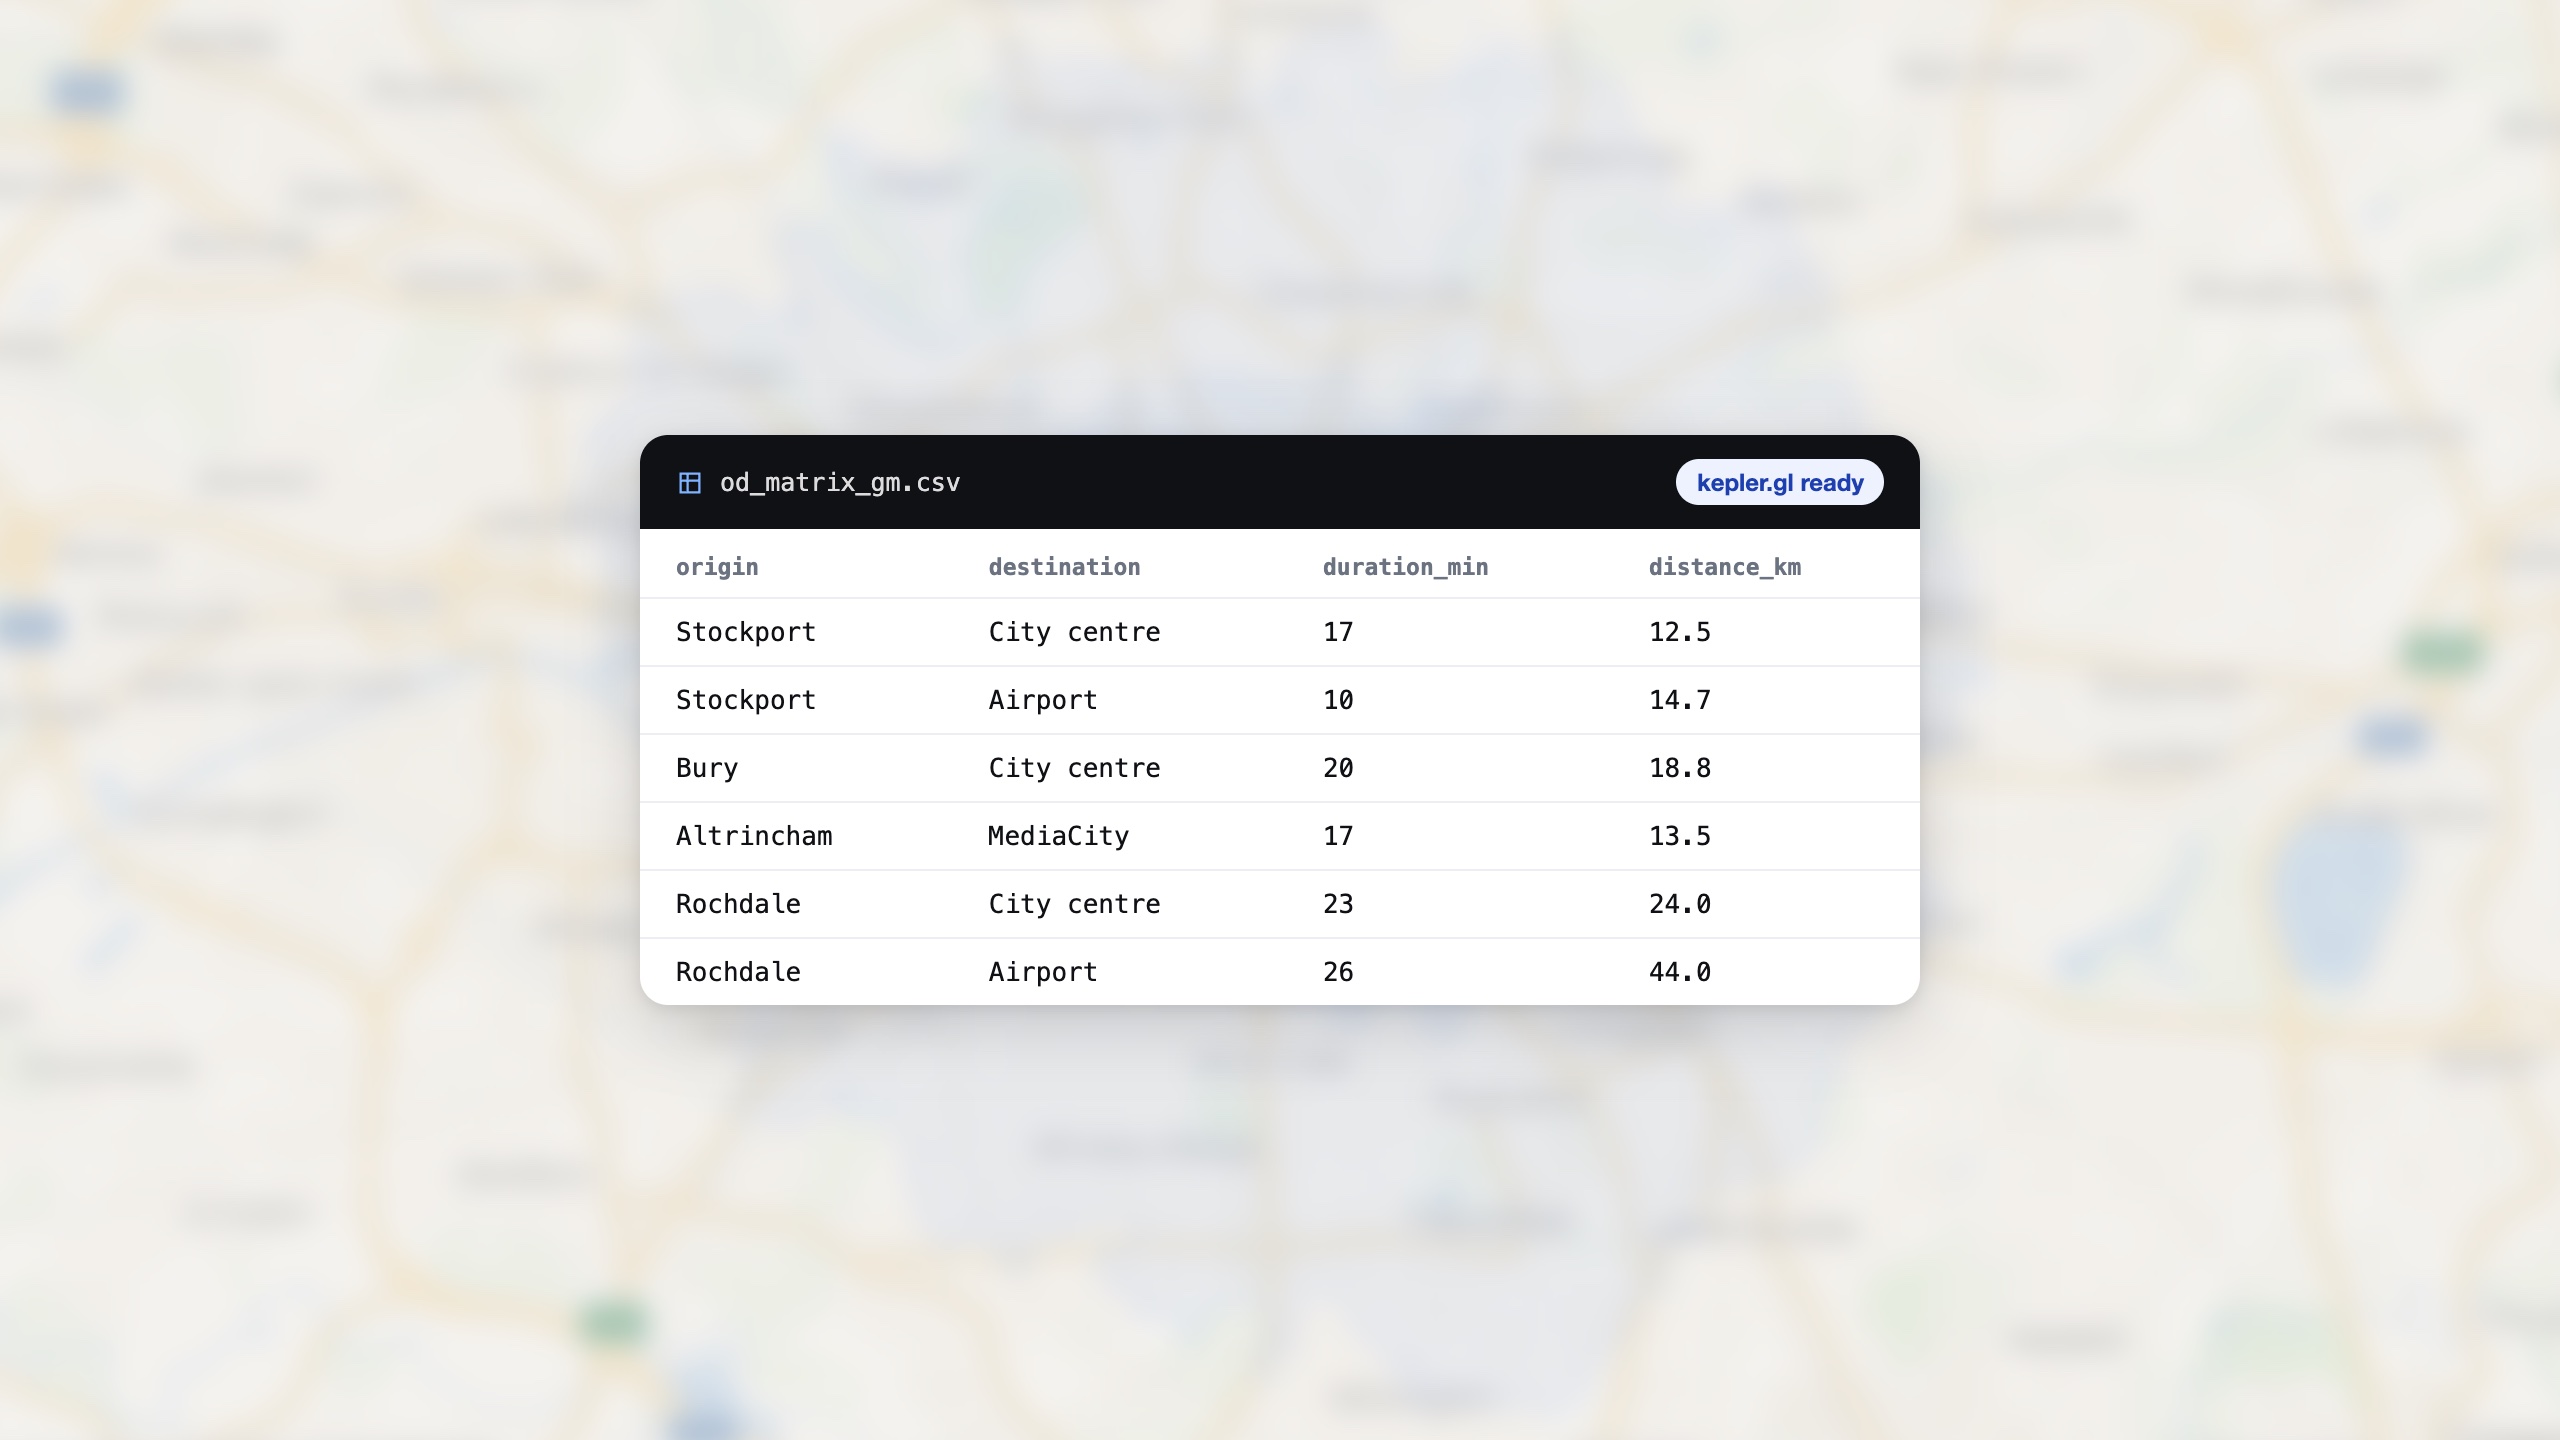
OD matrices, exported for GIS
The matrix engine behind fleet dispatch, repointed at accessibility questions. This CSV carries real minutes from one Greater Manchester call, shaped to drop straight into kepler.gl.
OD matrix guide →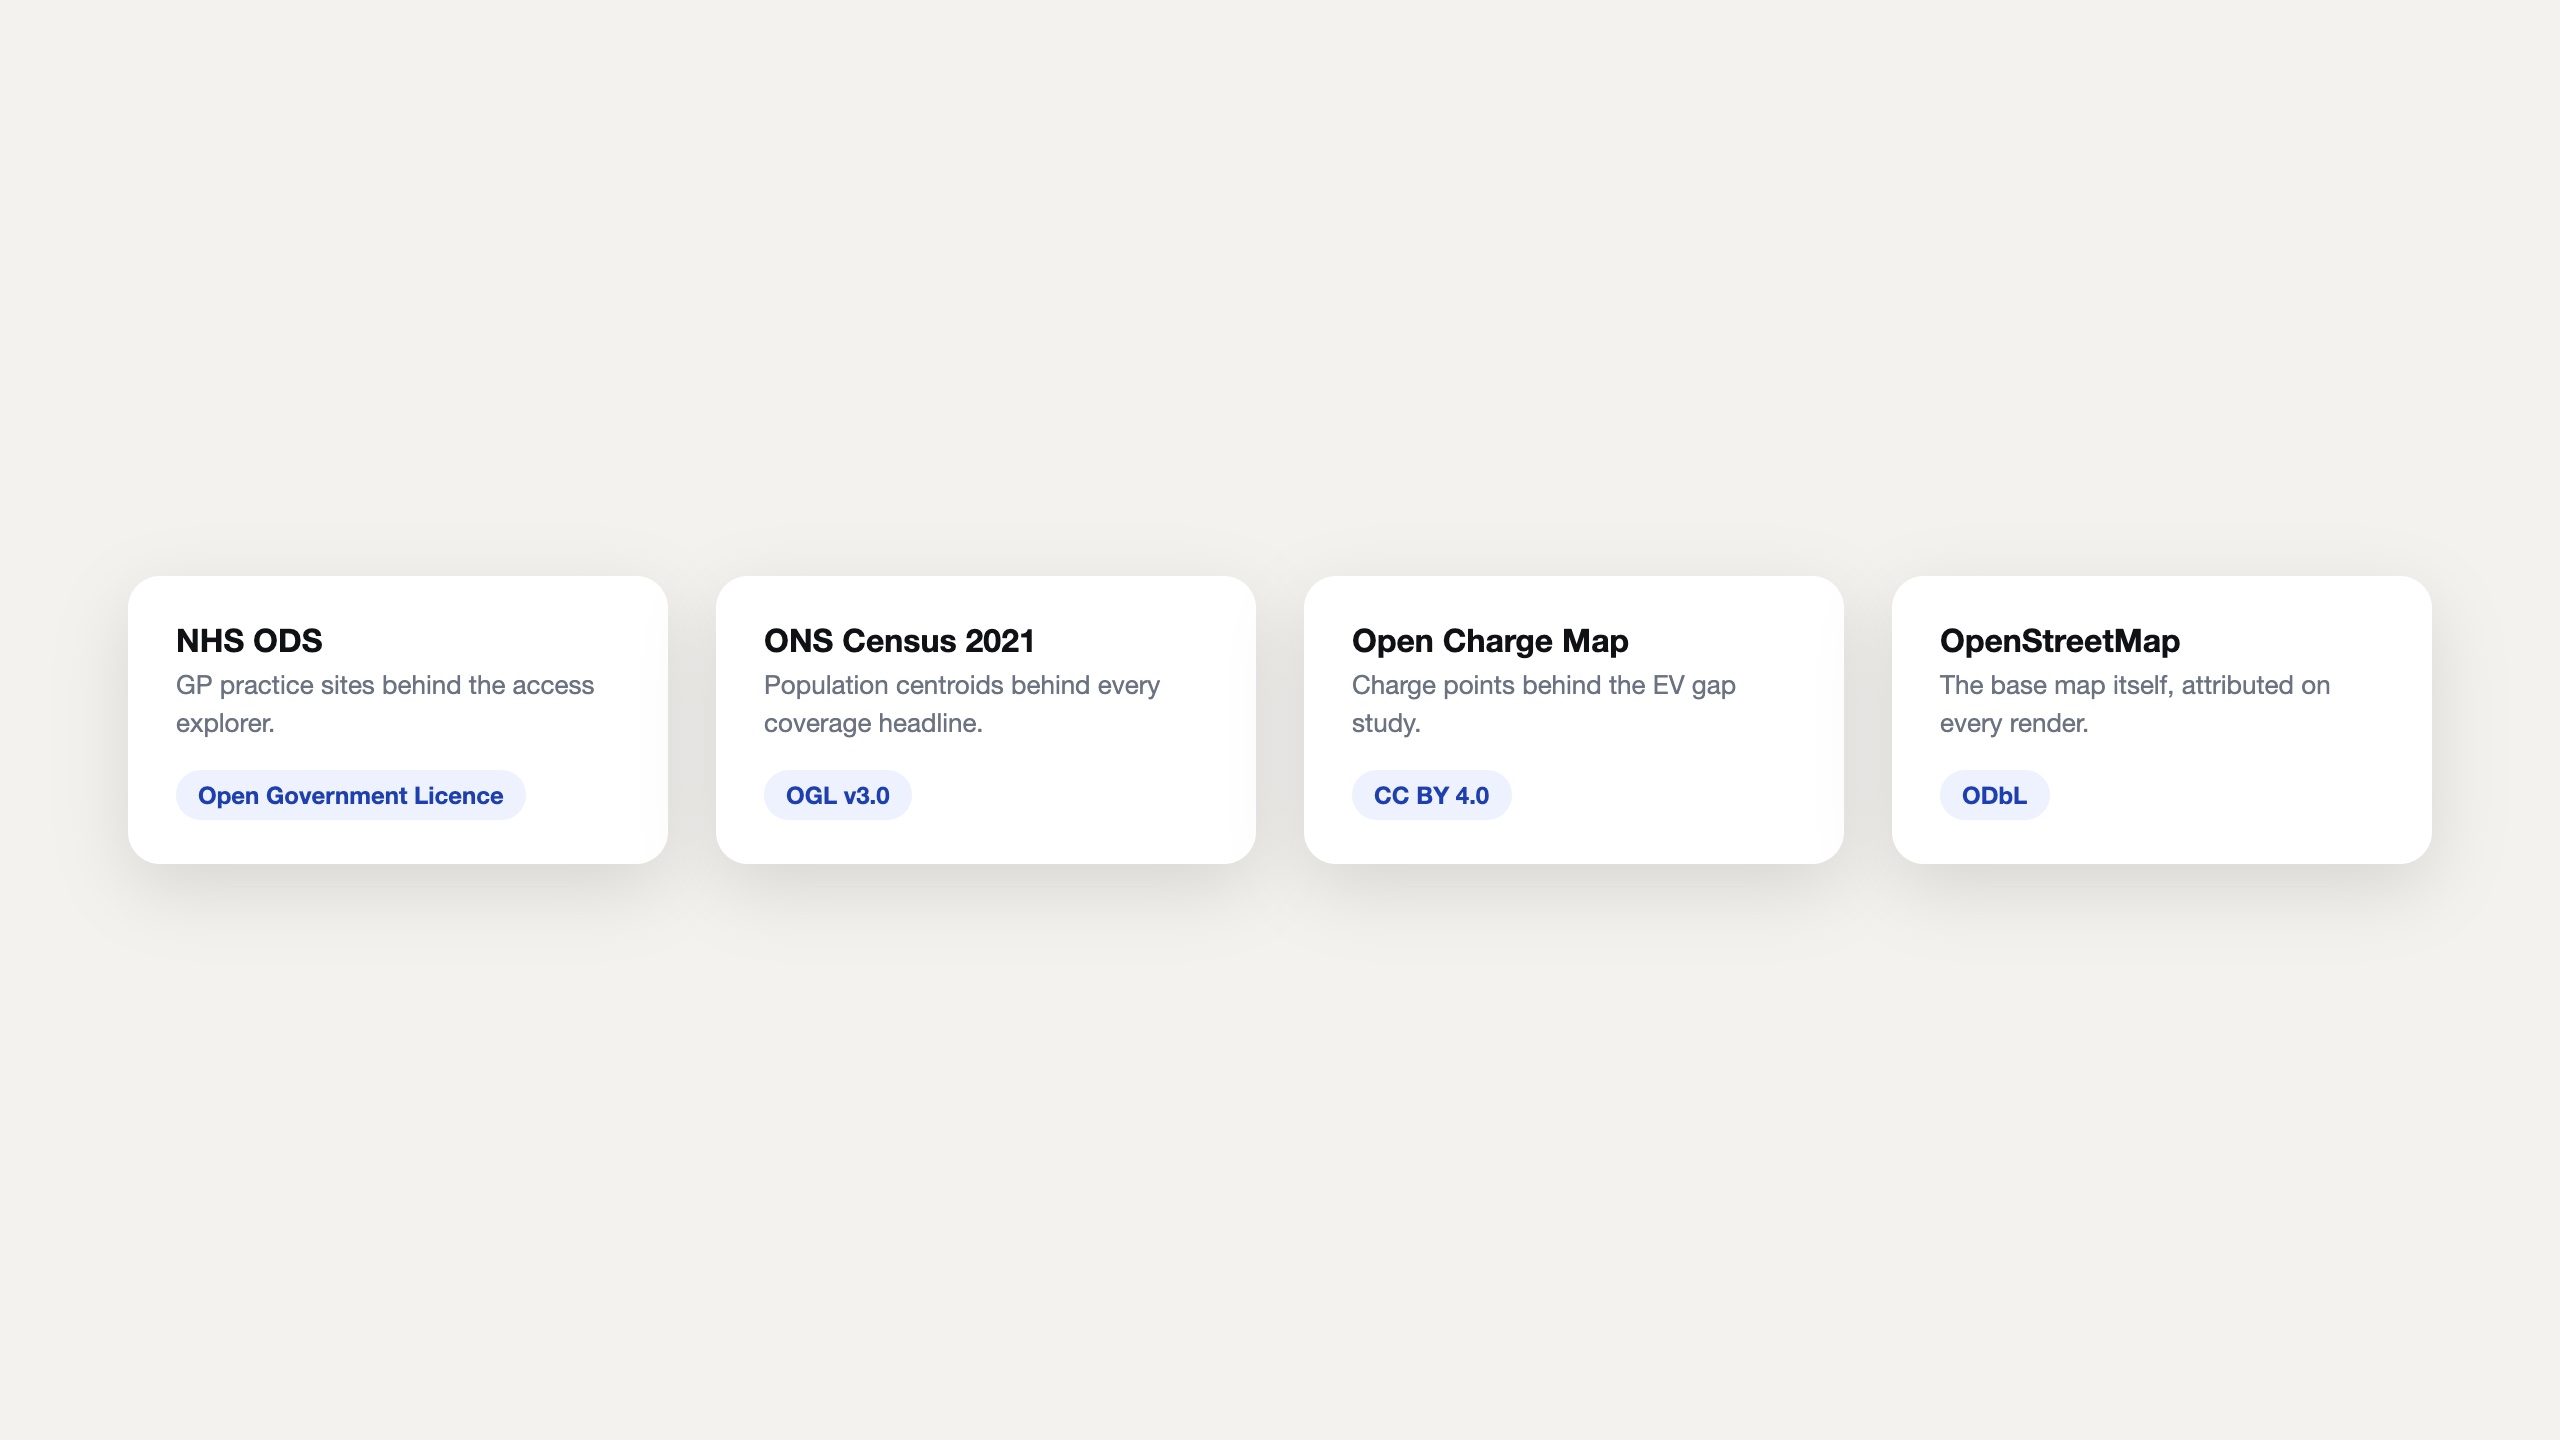
Every number traces to a licence
NHS ODS, ONS Census 2021 under the Open Government Licence, Open Charge Map under CC BY 4.0. Every figure names its source and its licence, with the caveats next to the headline.
Data residency and a procurement pack
Docker distribution, an SBOM and a security questionnaire ready for council procurement, and no per-call metering once it is on your infrastructure.
An API key without the sales call
A hosted MCP server, one-step installs for Claude, Cursor and VS Code, and a card-free API key in one call. Your analyst can script against real isochrone and matrix endpoints today.
Coverage is measured against open-data population centroids, not every doorstep, and open registries such as NHS ODS and Open Charge Map carry stale and dead entries, so headline percentages are indicative, not survey-grade.
Bring an area and an open-data source.
The access explorer and the EV gap finder on this site were built agent-first, against real endpoints. Your accessibility study gets built the same way, on your area.
What you are actually being offered.
On the page, not in the small print: the scope, the deliverable, the timetable and how the money works, before you spend an hour on a call finding out.
- Who it is for
- A planning, transport or policy team that needs reachability analysis it can publish, cite and re-run.
- What is in scope
- You bring an area and an open-data source, and the question the study has to answer. We build the study against real endpoints, the way the access explorer and the EV gap finder on this site were built.
- What you get
- A working study on your area: the isochrones, the population arithmetic and the map, with the method stated so a committee can see how the number was reached.
- How long
- Days rather than months. Data licensing on your sources is usually slower than the build.
- What it costs
- Scoped on the call. The analysis endpoints are metered on the published rate card, and a self-host licence removes the meter.
- Next step
- Bring the area and the question, and we will build the study on it.
Automotive
MapMap in the vehicle: a full navigation stack you host and control.
Trucking & Logistics
The router that refuses the bridges the map records, before your driver sees them, with dispatch-grade optimisation built in.
Fleet Optimisation & Dispatch
Plan the whole shift against skills, windows, capacities and rest, then follow it without handing anyone your drivers' positions.