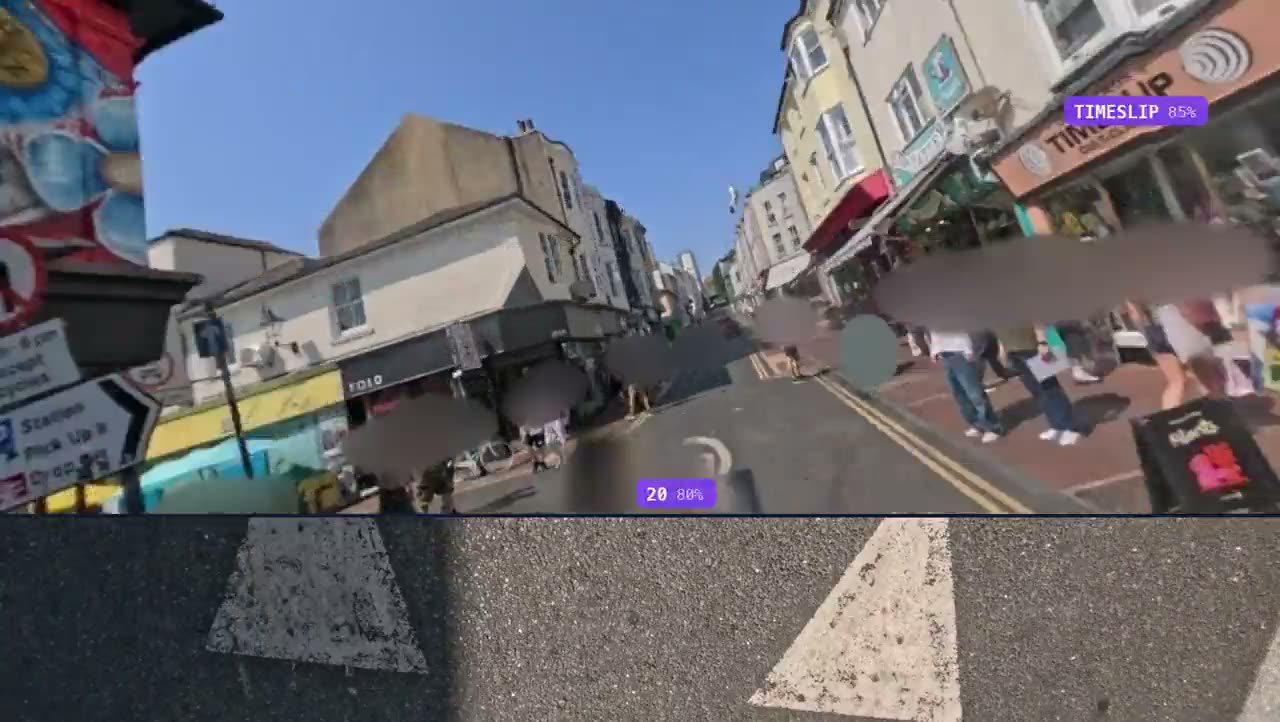
What stands beside the segments you commission, positioned, with the frame that proves it.
A positioned register of signs, markings, lighting columns and kerbs, each linked to the dated photographic frame it was read from, so an officer can answer 'what is on this street, and can you show me'. What exists is what has been driven: we make no claim to national coverage.
A survey record, not a picture library.
Every extracted feature is positioned, map matched to the road network and tied to the dated frame it came from. Anything the pipeline could detect but not read is recorded as an honest unknown rather than filled in.
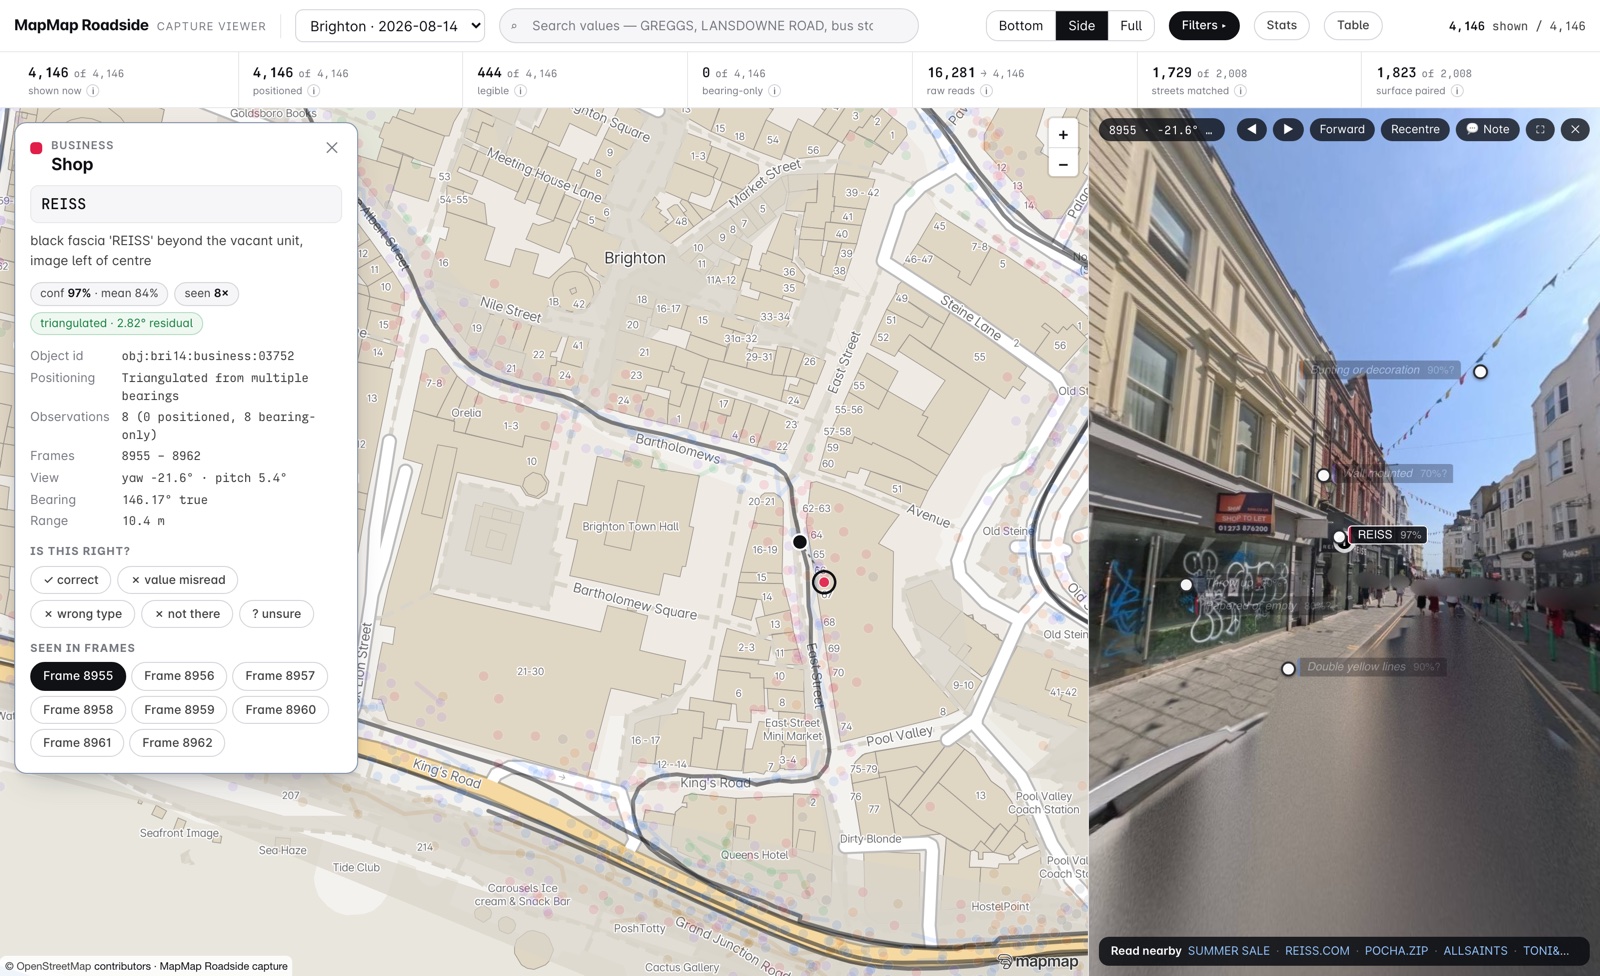
A dated evidence chain per feature
Each record names its source frame, capture date, position method and network reference. When a reading disagrees with the map you already hold, the record carries the frame that settles it. Imagery stays on our side, reached through per-feature links.
How a pass becomes a record →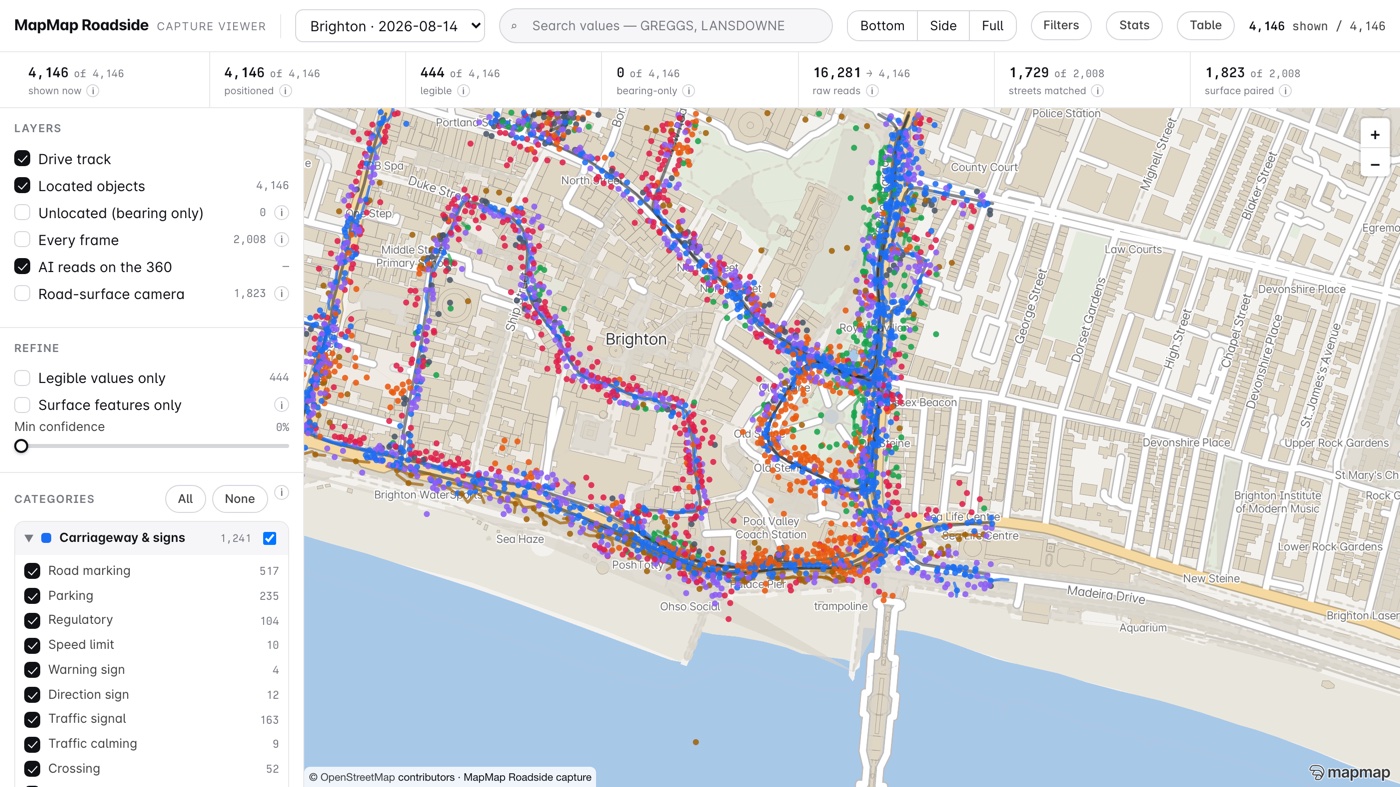
One GIS layer per asset class
Signs, road markings, street nameplates, lighting columns, street furniture, boundaries, trees and utility covers, delivered in British National Grid with a data dictionary and stable feature identifiers.
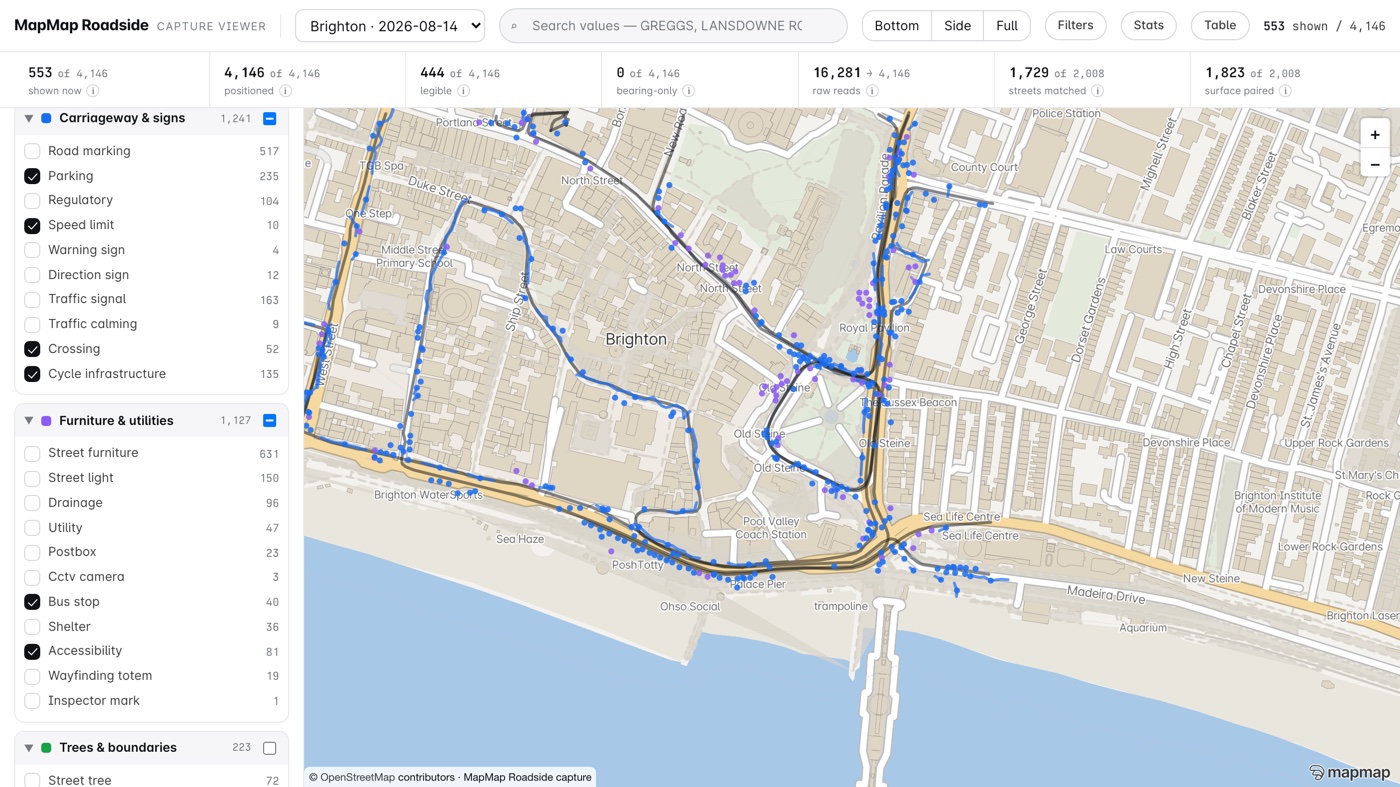
The kerb, as it is actually used
Dropped kerbs, tactile paving, crossings, parking restrictions, loading and waiting, EV and cycle provision: the layers that decide schemes and get argued about at committee, each with its evidence link.
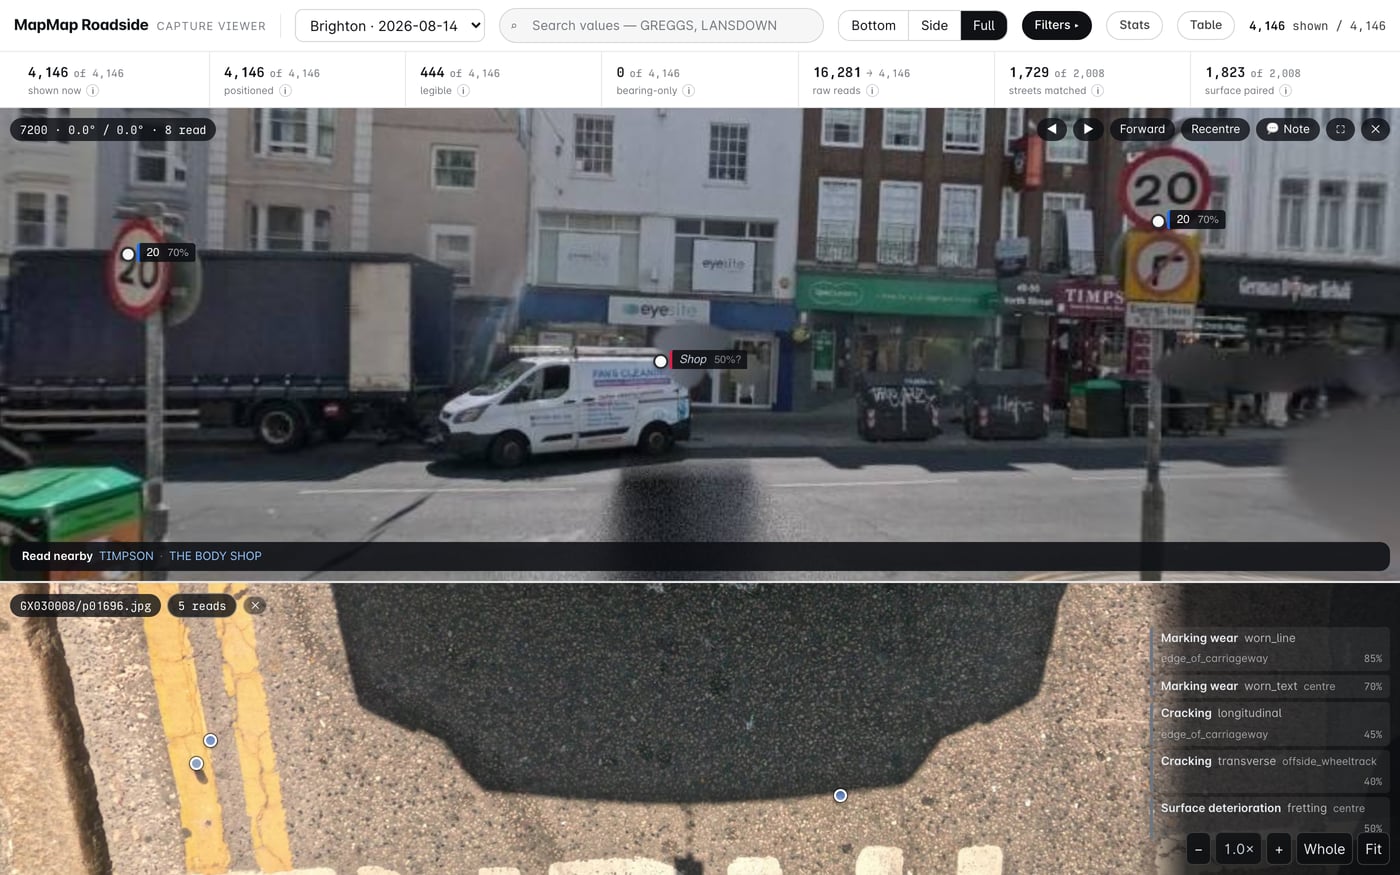
A second camera reads the road itself
A road-facing camera on the same vehicle captures the carriageway roughly every 4 metres: cracking, worn markings, patches, ironwork and the inspector's own painted marks, read back as graded observations. A visual grade for prioritising an inspection, never a measured depth. The same readings can steer routing: our router already uses them to pick smoother cycle routes.
Open the cycle routing demoChange arrives as a fresh dated pass
A pass is the unit of work. Commission a later pass over the same segment and the registers line up on stable identifiers, so what changed is a comparison you can defend rather than a guess.
Vacancy evidence with a date on it
Shopfront and unit condition with a dated photographic record per address, for vacancy registers and high street rental auction work where the date on the evidence is the point.
Where you already hold a lidar survey, ask it about the bridges
Height limits in the map are thin, and where a structure carries no tag a router treats the road as passable, which is a silent failure pointing the wrong way. Give us a lidar survey of a corridor you hold and we can bake a clearance field from it, then answer whether a vehicle passes under what was measured, with the limiting point and the bound on it. A MapMap Roadside pass is photographic and does not produce one on its own: this reads point geometry, and the answer is a measurement from a dated survey rather than a signed height or a certificate for the route.
How the measurement works →Roadside is asset inventory and evidence, not a statutory carriageway condition survey, and we do not hold the accreditation that would let us present it as one. Coverage is what has been driven, and each pass says where it went. Positional accuracy is not yet measured: the precision figure we publish is about whether a value we claimed to read was read correctly, not about how close a feature sits to its true position.
What this is not.
Kept on the page rather than in the small print, because a survey record is only worth what its caveats are worth.
Roadside is asset inventory and evidence. It is not a statutory carriageway condition survey, and we do not hold the accreditation that would let us present it as one.
Carriageway condition has its own road-facing camera and layer. Severity is a visual grade for prioritising an inspection, never a measured depth, and open-pothole detection is undemonstrated.
We make no claim to national coverage and do not sell by area covered. What exists is what has been driven, and each pass says where it went.
A value is only recorded when it can be read in the frame. Distant and obscured features stay as honest unknowns, and a later pass may resolve them.
Not yet measured. The precision figure we publish is about whether a value we claimed to read was read correctly, and it says nothing about how close a feature sits to its true position. When a positional figure exists it will be published the same way, with its sample and its confidence interval.
Multi-pass change reporting is in build. Until it ships, a re-survey is delivered as a fresh dated pass rather than an automated difference.
Frames are held by us and reached through per-feature evidence links. Publication of any imagery is gated on our data protection assessment and is not offered by default. What is captured, how it is blurred and how to ask for a frame to be removed are set out in the imagery notice.
Roadside imagery notice →Judge the record, not the pitch.
Ask and we will show you a live demo on ground we have already surveyed, then send a desk proof to keep: one street, delivered exactly as you would receive it. Both are free. A drive proof on your own network is £2,500, credited in full against any package you go on to buy.
What you are actually being offered.
On the page, not in the small print: the scope, the deliverable, the timetable and how the money works, before you spend an hour on a call finding out.
- Who it is for
- A highways, public realm or asset team that needs a positioned register with photographic evidence behind every record.
- What is in scope
- You name the segments. A pass is the unit of work: one drive of a segment on one date, delivered as layers by asset class in British National Grid with a data dictionary and stable feature identifiers.
- What you get
- A positioned register of the segments you commissioned, each feature carrying an evidence link to the dated frame it was read from, with the limits above stated in writing alongside it.
- How long
- Agreed per pass. A live demo on ground we have already surveyed and a desk proof of one street are available now, without waiting for a survey.
- What it costs
- A live demo and a desk proof of one street are free. A drive proof on your own network is £2,500, credited in full against any package you go on to buy. Package pricing is published.
- Next step
- Ask for the demo on surveyed ground, keep the desk proof, and judge the record before anyone drives anything for you.
Automotive
MapMap in the vehicle: a full navigation stack you host and control.
Trucking & Logistics
The router that refuses the bridges the map records, before your driver sees them, with dispatch-grade optimisation built in.
Fleet Optimisation & Dispatch
Plan the whole shift against skills, windows, capacities and rest, then follow it without handing anyone your drivers' positions.