Point clouds inside the map, not floating over it.
@mapmap/points draws lidar and photogrammetry clouds in the map’s own WebGL context: two interleaved buffers, one draw call, compositing with the basemap, the terrain and every other layer you already render. Ten bytes a point on the wire, your class bytes kept as written, and the same snk_ key that runs the rest of the platform.
50,000 free calls a month, card-free.
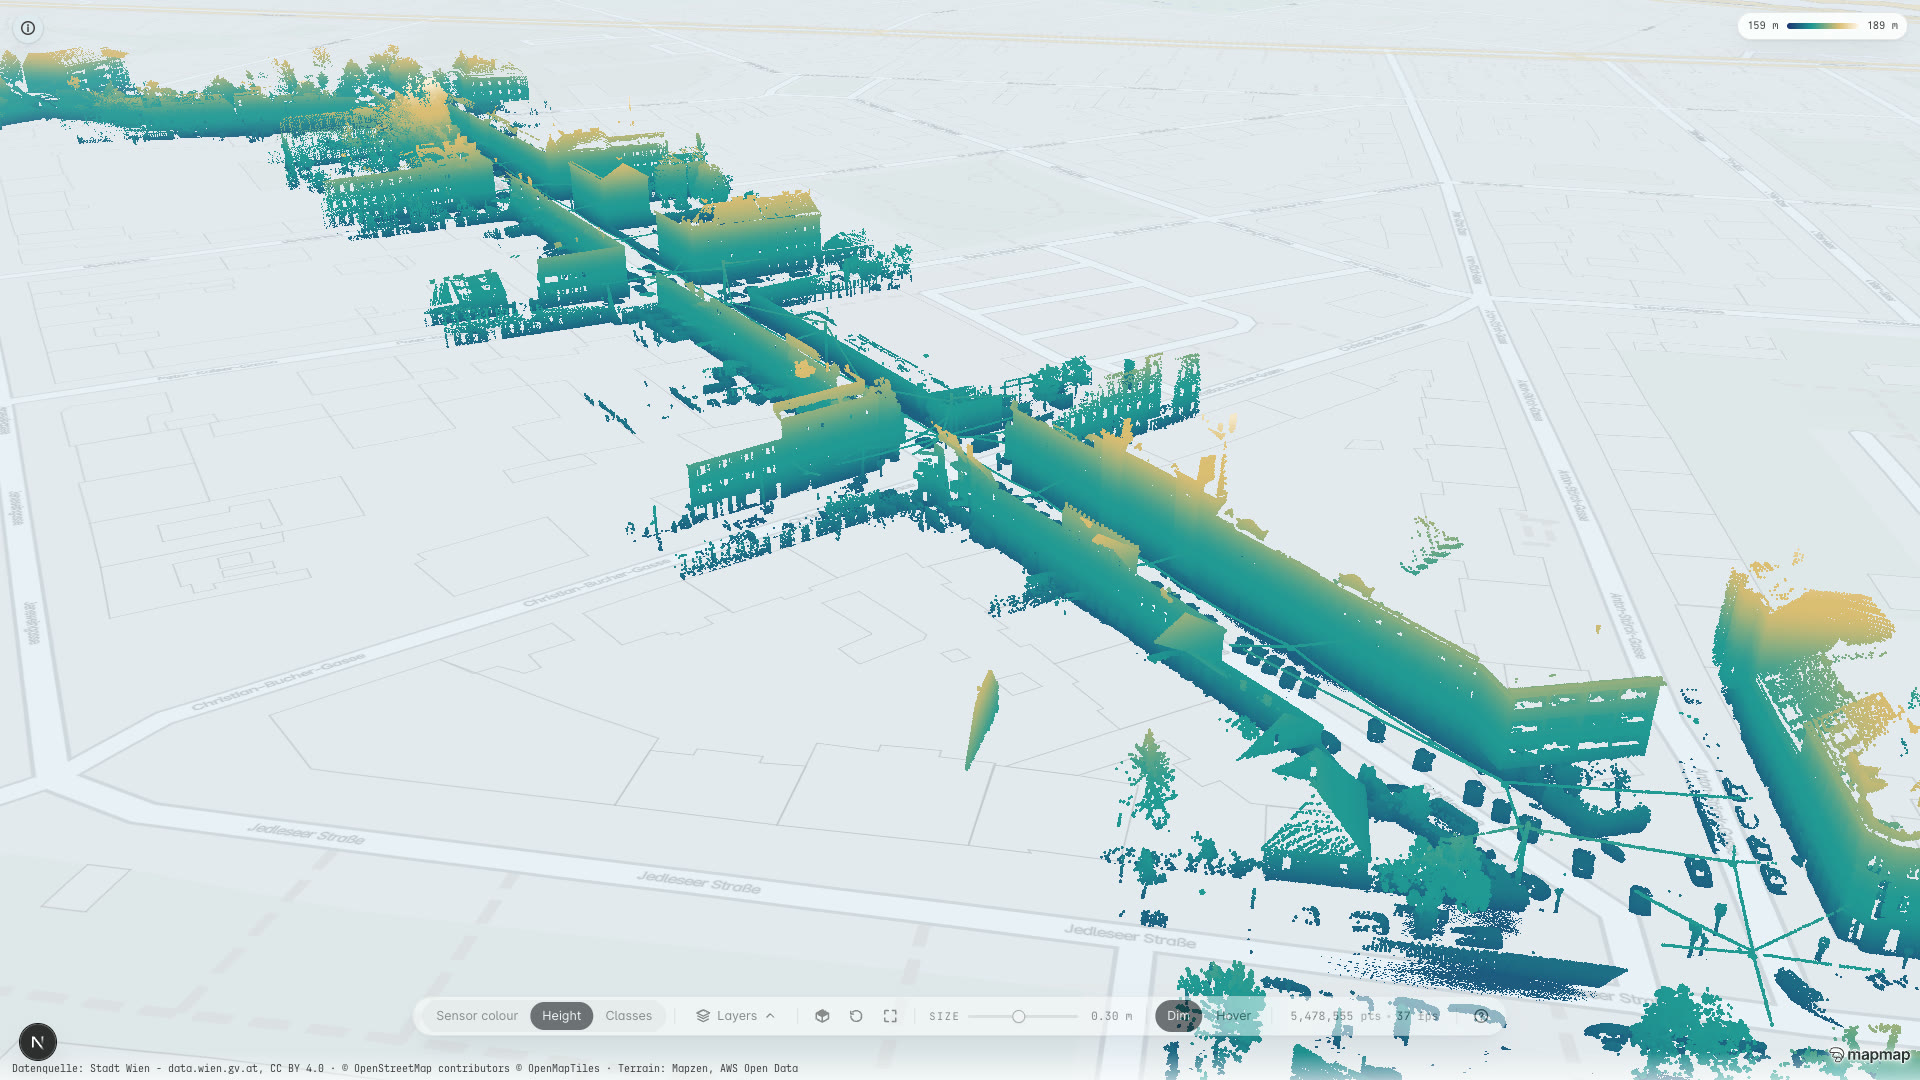
Point cloud: Stadt Wien - data.wien.gv.at, CC BY 4.0.
A package you run, a viewer we run, and a measured answer.
They are bought separately and priced separately. Each section below ends with its own next step, so you can take one and leave the other two.
The SDK
@mapmap/points on npm. You bake the cloud, you host the two files, the package draws them inside your MapLibre map. Drawing the points is never a metered event.
What the layer doesThe managed viewer
We take your survey delivery, bake it, agree the class table as you number it, and stand a viewer up on your branding and your domain. Fixed price, not a subscription.
What a bake and a viewer costMeasured clearance
Overhead clearance along a route, read from the survey's own geometry rather than a map tag, reported with its uncertainty bound and the coverage it rests on. Never a signed or legal height.
What a clearance package coversOne draw call, ten bytes a point, your class table.
The package installs from npm today and renders payloads you host yourself, against the hosted gateway at api.mapmap.ai or your own self-hosted deployment.
Inside the map's WebGL context
A MapLibre CustomLayerInterface sharing the map's WebGL context. The cloud is depth-correct against terrain and 3D buildings, moves with the camera exactly as the basemap does, and costs one draw call. With terrain on, terrainRelative rebuilds the eye position from the terrain surface, so point sizes and fog distances are computed from where the camera actually is.
Ten bytes a point
Three Uint16 positions and four Uint8 bytes of colour, class in the alpha byte. About 48 bytes a point becomes 10, and both blocks reach the GPU untouched: decoding is two typed-array views over the downloaded ArrayBuffer, with no copy and no per-point loop. The shader dequantises.
Your classes, your colours
The SDK has no opinion about what a class byte means. Pass your table and your byte values survive: 40 stays 40. Colour by the payload's own RGB, flat per class, or a height ramp, and build the legend from getClasses().
Bake it offline, then add one layer at runtime.
Bake to the 10-byte format, offline.
Production baking happens offline, in Python or Rust, and produces one JSON sidecar and one binary blob. encodePointCloud exists for small clouds built in the browser. The sidecar carries anchor as [lng, lat], quant in metres per position unit, origin, count, the local bounding box, the class table and terrainRelative. validateMeta fails a sidecar whose extent will not fit the format rather than letting a cloud fold back on itself: at the default 2 cm quantisation a Uint16 axis spans 1.3 km.
One draw call.
Positions and colours are uploaded as two interleaved buffers and drawn as a single THREE.Points call inside the map’s context. There is no level-of-detail tree and no paging: everything is resident, which keeps the layer simple and puts a hard ceiling on how big a cloud can be.
The class table is an input.
| Field | Meaning |
|---|---|
| value | Your class byte, 0 to 255, preserved as written |
| label | What the legend shows |
| colour | #rrggbb or an [r, g, b] triple in 0 to 1, optional |
| visible | Initial visibility, optional |
Up to 16 classes per layer, a WebGL1 uniform-budget limit. Duplicate bytes, out-of-range values and oversized tables throw at load. Omit the table entirely and you get RGB and height colouring, and setColourMode("class") throws rather than inventing a taxonomy.
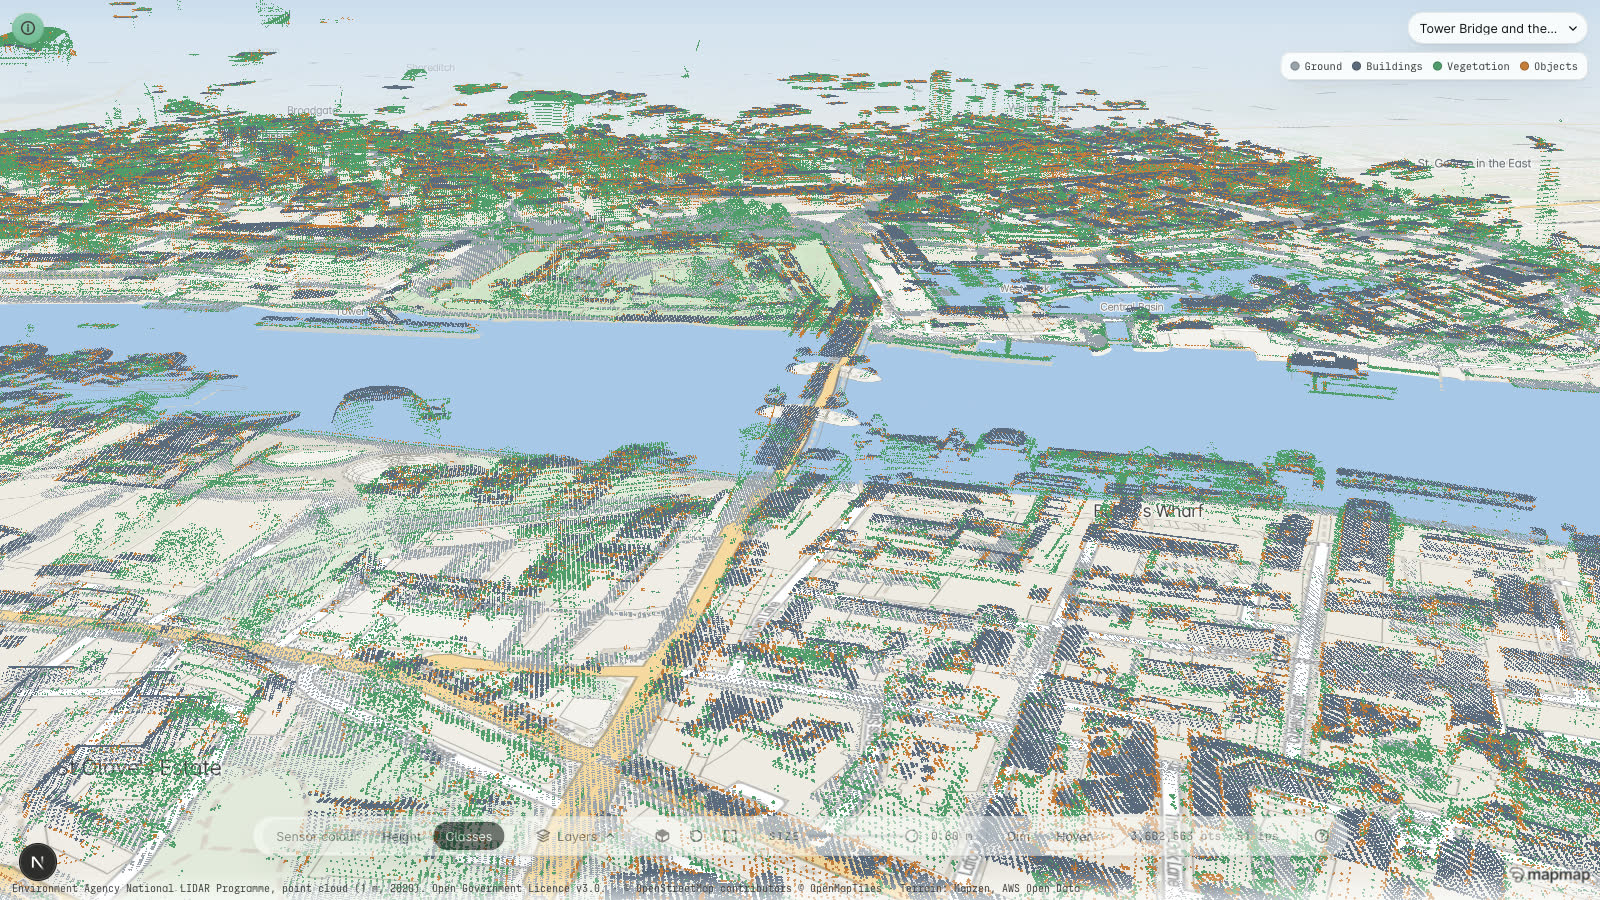
Colour modes and runtime controls.
| Mode | What it shows |
|---|---|
| rgb | The payload's own colours, the default |
| class | Flat per-class colours from your table |
| height | A ramp over local height |
Drive it from your own UI: setColourMode, setClassVisible, setAllClassesVisible, setPointSize in metres, getFps for a rolling one-second average, getClasses for the resolved table. A point is 0.15 m in the world by default and capped at 10 device pixels on screen, which you raise for offline video bakes.
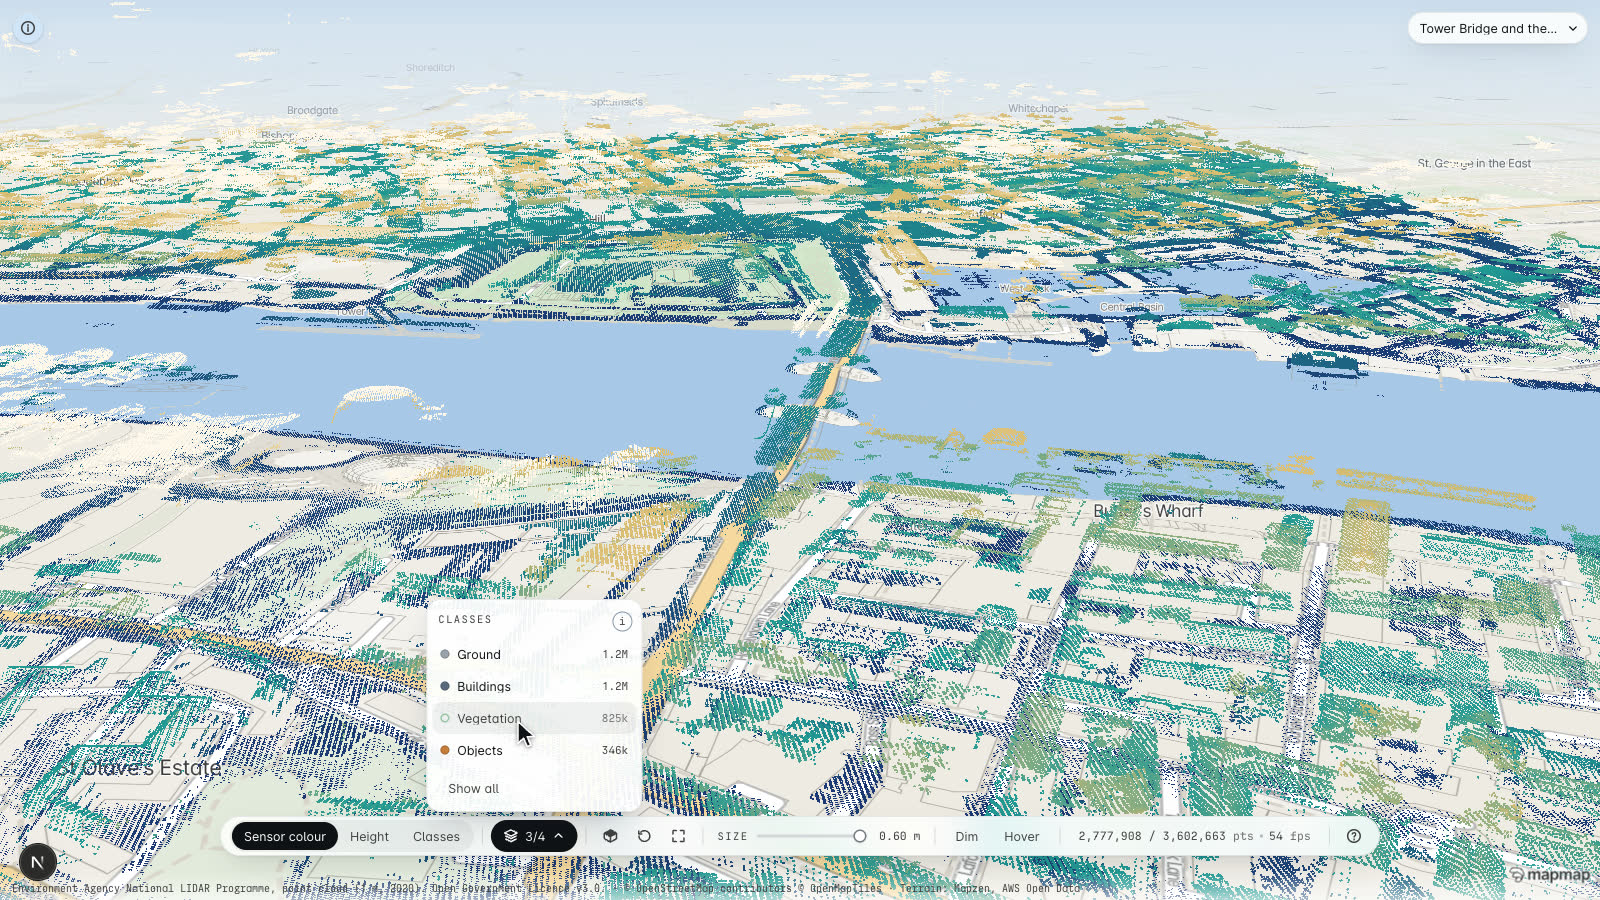
Contains Environment Agency data. © Environment Agency and database right. Open Government Licence v3.0.
Install it, then add the layer.
npm install @mapmap/points three maplibre-gl<div id="map" style="height: 480px"></div>import { classesFromMeta, createPointCloudLayer } from "@mapmap/points";
const [meta, raw] = await Promise.all([
fetch("/cloud.json").then((r) => r.json()),
fetch("/cloud.bin").then((r) => r.arrayBuffer()),
]);
map.on("style.load", () =>
map.addLayer(
createPointCloudLayer({ meta, raw }, { classes: classesFromMeta(meta.classes ?? {}) }),
),
);three and maplibre-gl are peer dependencies, and the app must provide a single shared copy of each: two MapLibre instances on one page break the WebGL context, and two copies of three give you two incompatible sets of classes. @mapmap/points is v0.5.0, ESM only, and needs Node 18 or later to build. See the full SDK reference.
Point cloud rendering, in five facts.
| Fact | What it is |
|---|---|
| Version | 0.5.0 |
| Where it works | Wherever the survey is. A streamed COPC is placed from its own WKT record: geographic, Web Mercator, Transverse Mercator (every UTM zone, BNG, MTM) and Lambert Conformal Conic 2SP. Anything else throws UnsupportedCrsError naming the CRS. The baked path reprojects nothing at all, and neither path performs a datum shift. |
| Hosted | Nothing to enable and no MapMap service in the request path: the layer runs in the browser against the COPC or baked payload you serve. A managed viewer on your branding and your domain is a fixed-price engagement rather than a subscription. |
| Self-host | The same npm package against files served from your own storage, so a deployment inside your network renders clouds with nothing leaving it. |
| Extra configuration | three and maplibre-gl are peer dependencies and the app must provide a single shared copy of each. ESM only, Node 18 or later to build, and laz-perf only for the streamed COPC path. One COPC per layer: multi-file mosaics and EPT sources are not in this version. |
A renderer, not a platform.
You should know where it stops before you spend a day on a trial.
One COPC per layer. openCopc streams a single file over HTTP range requests. Multi-file mosaics and EPT sources are not in 0.5.0, and a plain LAZ is not a COPC: pdal translate converts one in a single command.
The baked path is still not an LOD system. A 10-byte payload is fetched whole and stays resident, which works comfortably to a few million points on a modern GPU. Past that, bake to COPC and stream it, or split the area into several clouds and swap layers by viewport.
CRS support has edges. A streamed COPC is placed from its own WKT record: geographic, Web Mercator, Transverse Mercator (every UTM zone, BNG, MTM) and Lambert Conformal Conic 2SP. Anything else throws UnsupportedCrsError naming the CRS, and a toWgs84 hook takes you past it. The baked path reprojects nothing at all: the sidecar's anchor is trusted as lng/lat, so check an uncertain dataset first with validate_geodata or POST /geodata/validate. Neither path performs a datum shift.
No annotation, and no share links. Neither exists in the SDK today. Measurement does, but not in the browser and not as a drawing tool: overhead clearance is measured server-side against a baked clearance field, and the SDK carries the answer and its bound rather than the arithmetic. There is still no interactive measure tool on the layer.
The points are not a metered event.
You host the payloads and the package renders them, so drawing the points never hits our meter. What meters is the map underneath: the same snk_ key as the rest of the platform, issued card-free with 50,000 free calls a month, or nothing at all once the stack is running on your own infrastructure.
That is the whole of the SDK offer: you bake, you host, you render. If you would rather we did the baking and the hosting, that is the next section. If what you want is a height answer off the same survey, that is the one after it.
We bake it, we host it, and you get a viewer on your own domain.
Everything above assumes you run the package yourself. This is the same renderer with the work done for you, sold as a fixed price rather than a subscription.
If the cloud is not baked yet, that is a fixed-price package rather than a subscription. A site or corridor bake is £3,600: we take your survey delivery, bake it to the wire format, agree the class table as you number it, check the declared CRS against the coordinates and stand a viewer up on the deployment you will actually use, then hand over the payload and its sidecar for you to serve. A complex bake, where the classification is mixed or undocumented or the CRS has to be reconciled before anything can be trusted, is £6,000. After handover there is nothing recurring: no per-point charge, no per-payload charge, no charge for looking.
If what you want is not the files but the thing working, that is a fixed price too. A survey viewer is £18,000: your own survey stood up as a hosted viewer on your branding and your domain, with the point cloud, the street-level imagery where you already hold it, and navigation, search and review tooling on top of it. A city-scale viewer is £48,000, which is the same at whole-city scale with everything navigable and place search across the city. A regional viewer is £95,000, which takes two to four authorities or cities as one continuous scene, searchable and navigable throughout. Programmes covering a wider network, repeat capture on a cadence, or integration into your own systems start at £180,000 and are scoped per network, with an annual platform fee of £60,000 to £120,000 by network size. We publish that floor rather than saying contact us, so you know the league before the first call. The capture itself, feature extraction and anonymisation of imagery you supply are quoted separately. Drawing the points is still never a metered event, and there is no per-seat viewer licence.
If you would rather we hosted and served the payloads too, that is live, self-serve and priced. Every viewer delivery includes 250 GB of storage, and above that storage is £3.50 per GB a year, billed against measured stored bytes, pro-rata to the byte, with no step at the boundary. Serving those payloads is not charged separately: we charge for storing the bytes or for serving them, never for both. What still meters is the map underneath, on the same snk_ key as everything else. Payloads are baked and staged by us rather than uploaded self-serve, and rendering payloads you host yourself stays free and unmetered: hosting on MapMap is optional, never required.
A height answer that does not depend on a map tag.
A truck router enforces the height restrictions the map records. Where a structure carries no tag it has nothing to act on, so it returns the road as passable and the answer looks exactly like one where every structure was checked. That failure is silent, and it points the dangerous way. In one UK OpenStreetMap extract, 18,353 ways carry a maxheight tag out of 8,212,278 highway ways, and 107 carry the physical-clearance tag maxheight:physical. Both numbers are ours, and both are published with their denominators.
Given a route shape and a vehicle, the gateway walks that corridor over a survey’s own geometry and reports whether the vehicle passes, and if not, where, by how much and with what uncertainty, with a deep link to that exact spot in the viewer. It reads geometry rather than attributes, so it finds the things a tag rarely describes: a branch over a lane, a temporary gantry, a service run slung under a deck.
It measures the gap, not the sign
The gap between the road surface and the lowest validated surface above it, both heights read from the same cloud on the same day, which is what makes the vertical datum cancel out of the difference. A posted height is a road authority's statement carrying somebody's margin and legal force. These are different quantities, and no response describes one as the other: the enforcement block on every answer, including the clear one, reports route_certified as false, and the type has no value that serialises to true.
Unsurveyed ground is never clear
A survey that looked and found nothing above the corridor is a measurement. Ground no survey reaches is the absence of one, and so is ground the survey reached too thinly to decide on. All three arrive as different things, and a passing verdict accepts only complete coverage: the wire format has no field for a gap on a pass, so a route that passes over unsurveyed ground cannot be represented rather than merely being discouraged.
Every figure travels with its bound
A measured headroom, its uncertainty, a one-sided sampling bias bound, and the safe figure the verdict is drawn from. The safe figure is the one to plan against, and a vehicle that clears the measurement but not the bound gets an indeterminate answer with the shortfall stated, never a pass. The formatter takes the whole measurement rather than a value, so a figure cannot be rendered on its own by accident.
Turning survey data into gauging and clearance outputs is already bought at scale, as a batch service delivered weeks later. Network Rail paid Cordel £4,336,000 for point cloud data processing (Find a Tender notice 030479-2026), and National Highways paid IBI Group £556,560 for “online visualisation and interaction with the data outputs with driven imagery and LiDAR data” (Contracts Finder, expired February 2025). Both are public procurement records about other organisations, quoted here as market context rather than as our own work. What is shipped here is that class of output answered per request, against a route.
An answer is a measurement from a dated survey with a stated bound. It is not a signed or legal height, not a statement about signage, and not a certificate for the route. Verify signed restrictions before dispatching a load.
Overhead clearance, read from the survey you already own.
The same baked geometry that draws in the viewer will also answer how much room is under a structure. Three fixed prices, published, so you can check one against your own authority before you speak to anyone.
Clearance audit
£6,500
The survey you already hold, compared against the OSM height tags for the same network: what carries no tag at all, what disagrees with your survey, and by how much. A report and a per-structure table. It asks you to trust your own survey, not our measurement.
Clearance corridor
£14,000
Measured clearance published live in the viewer and on the API for one corridor or a small network, so a planner and a routing client read the same figure.
Clearance network
£24,000
The same across a network, covering 150 centreline km, then £90 per centreline km beyond it.
Prices are published and fixed up to £24,000. Larger networks are scoped per network and quoted as a fixed price after scoping, rather than asked to contact us for a rate. On the API a clearance query is five standard calls, more than an ordinary call because it reads the survey geometry along the whole corridor, and well under a truck call because a safety answer should not carry a premium. The audit endpoint is not metered, because the audit is already bought at a fixed price.
What a measured clearance is, exactly. A within-survey figure, reported with its uncertainty bound and with the coverage it rests on. It is not a signed, legal or certified height, it is not a structural assessment, and it does not replace a bridge owner’s own records. Ground the survey did not cover is reported as not surveyed, never as clear.
A clearance field is separate work and is not part of the bake or viewer packages above. It is a second bake off the same survey with its own inputs, its own refusals and its own review of what it declined to answer, so it is scoped against the corridor or the network you want measured rather than sold off a list. Tell us what you hold and we will scope it.
Issue a key and put a cloud on the map.
Card-free, with 50,000 free calls a month. Bake a corridor, fetch two files, add a layer.