Location intelligence without the metered bill.
Analytics platforms embed maps and immediately meet two problems: per-load pricing and data egress. Self-hosted MapMap solves both, with geocoding, travel-time matrices and isochrones as plain APIs.
The location layer as infrastructure, not a line item.
Every block below is a shipped API already driving the public analysis demos on this site.
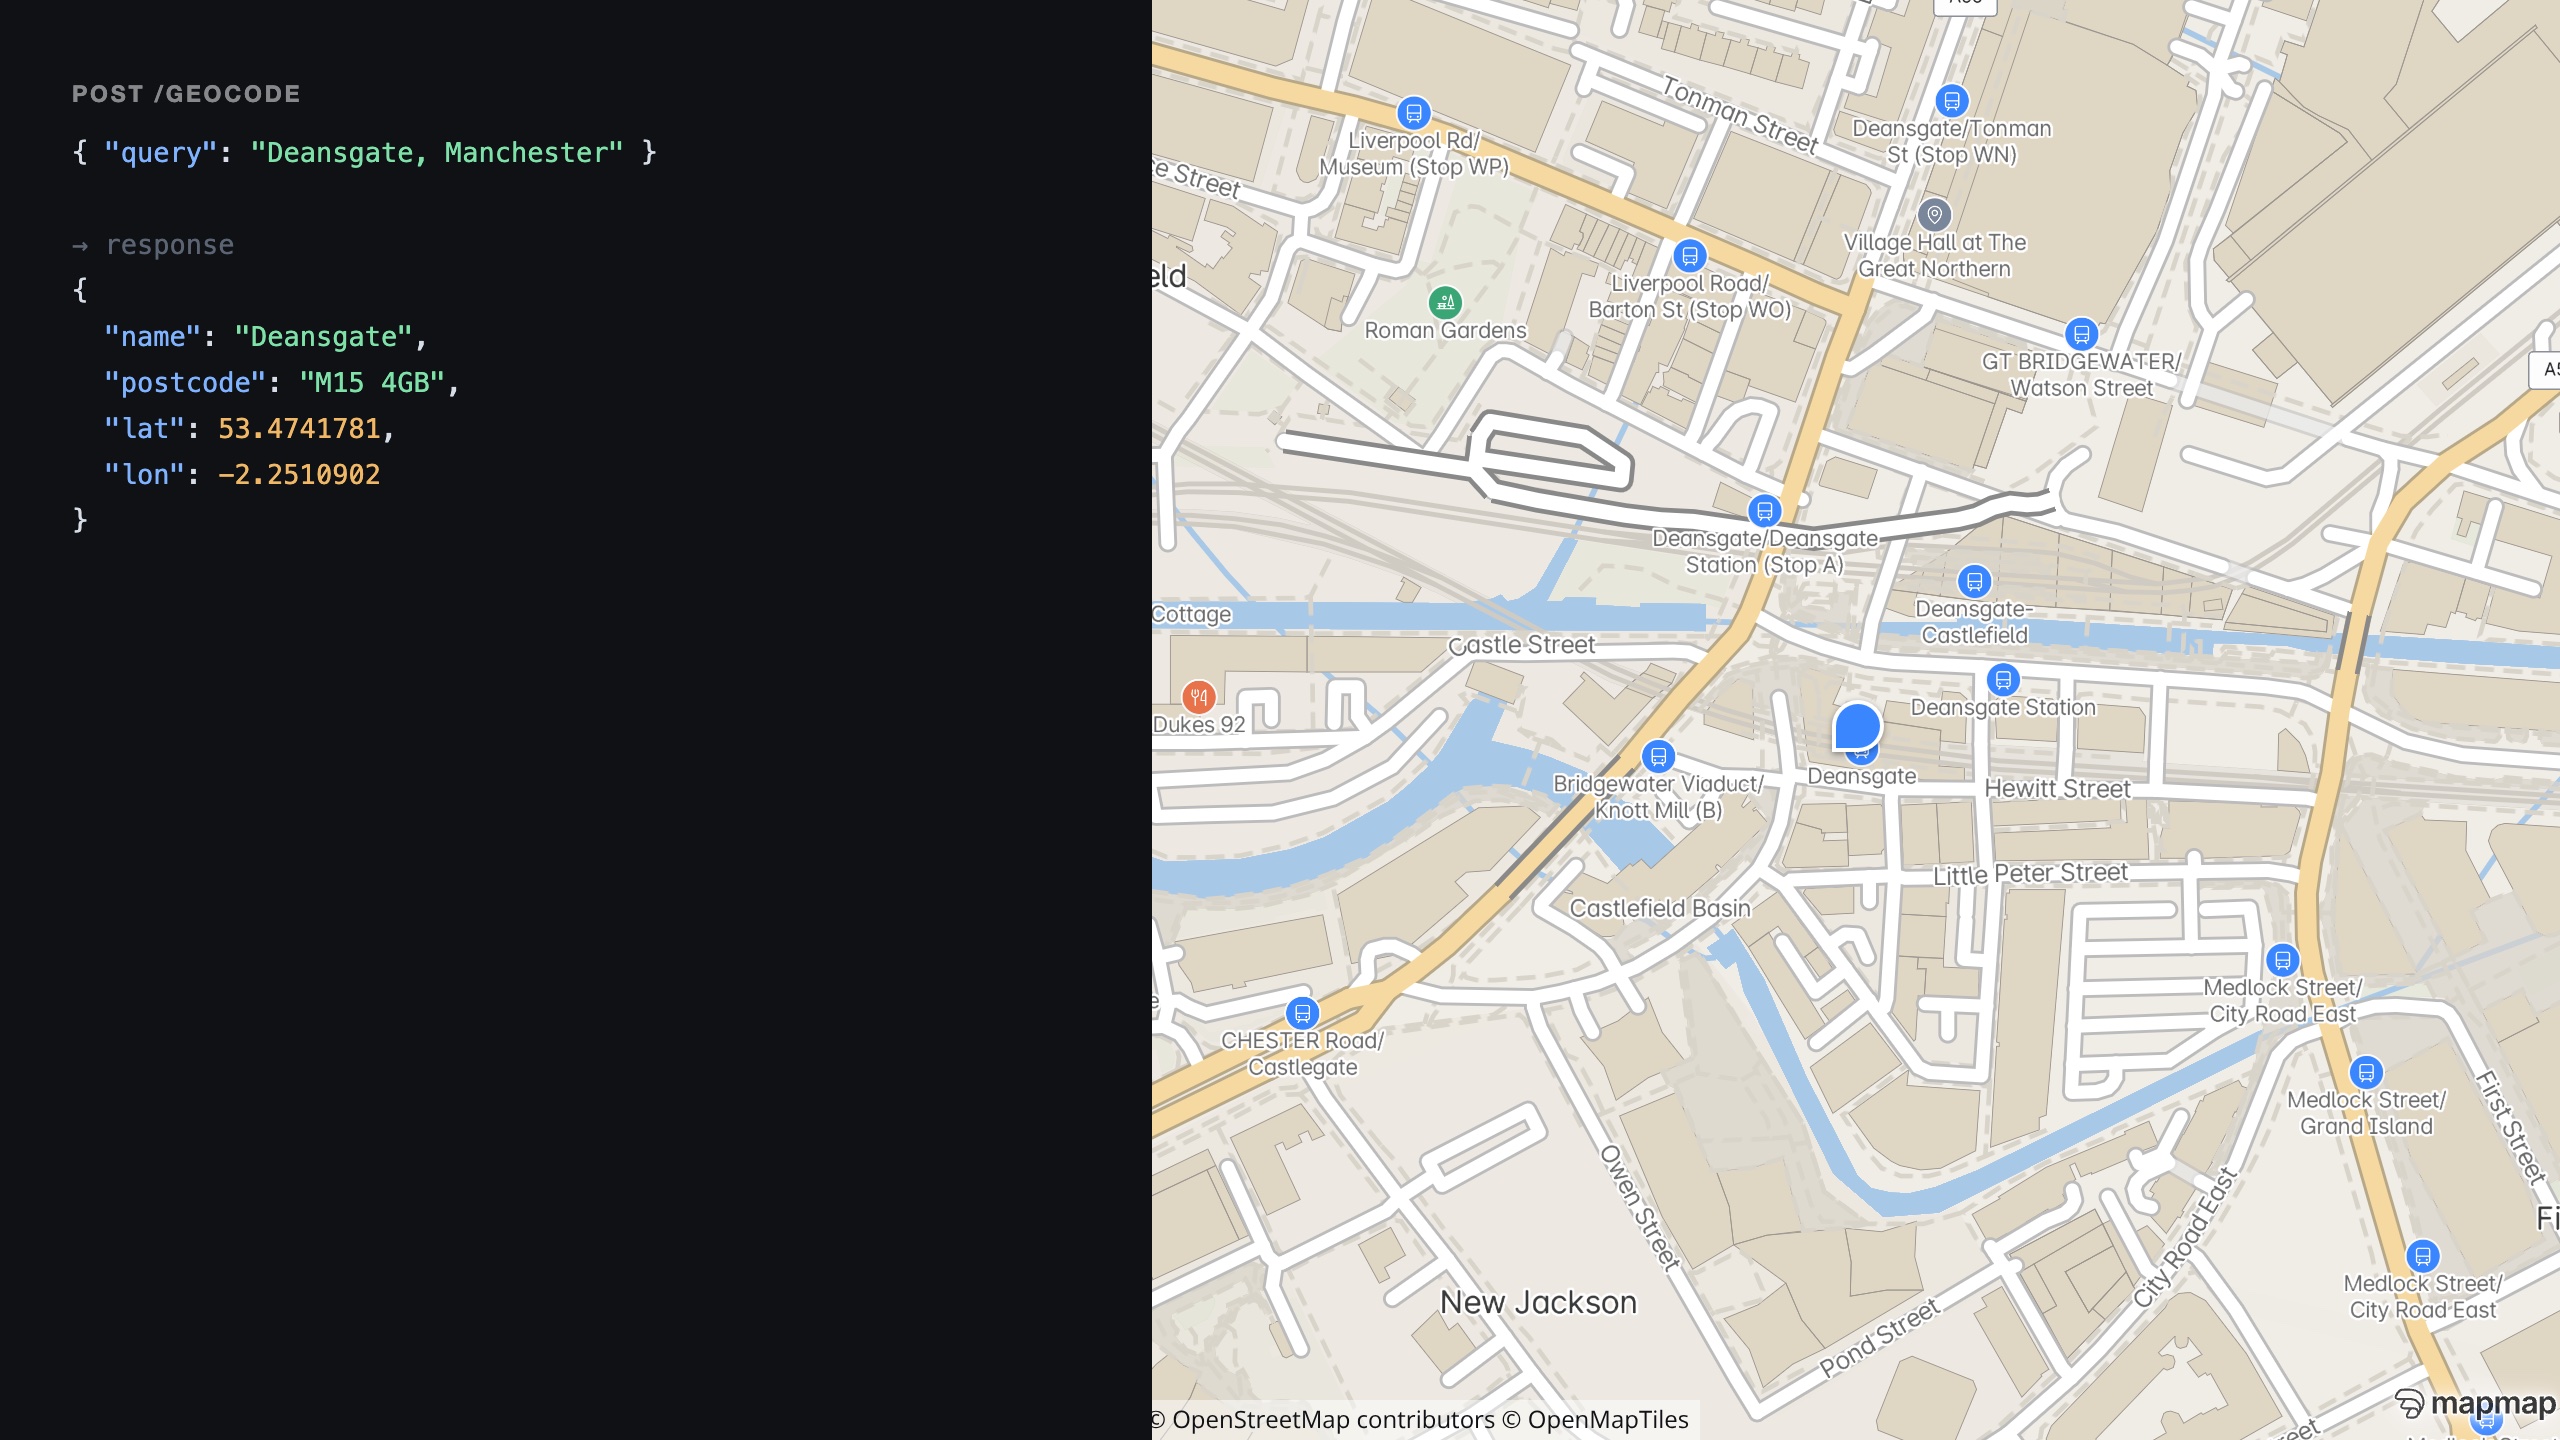
Addresses in, coordinates out
Forward and reverse geocoding turn messy address columns into coordinates and back, with structured results your pipeline can interrogate. Batch it on your own box.
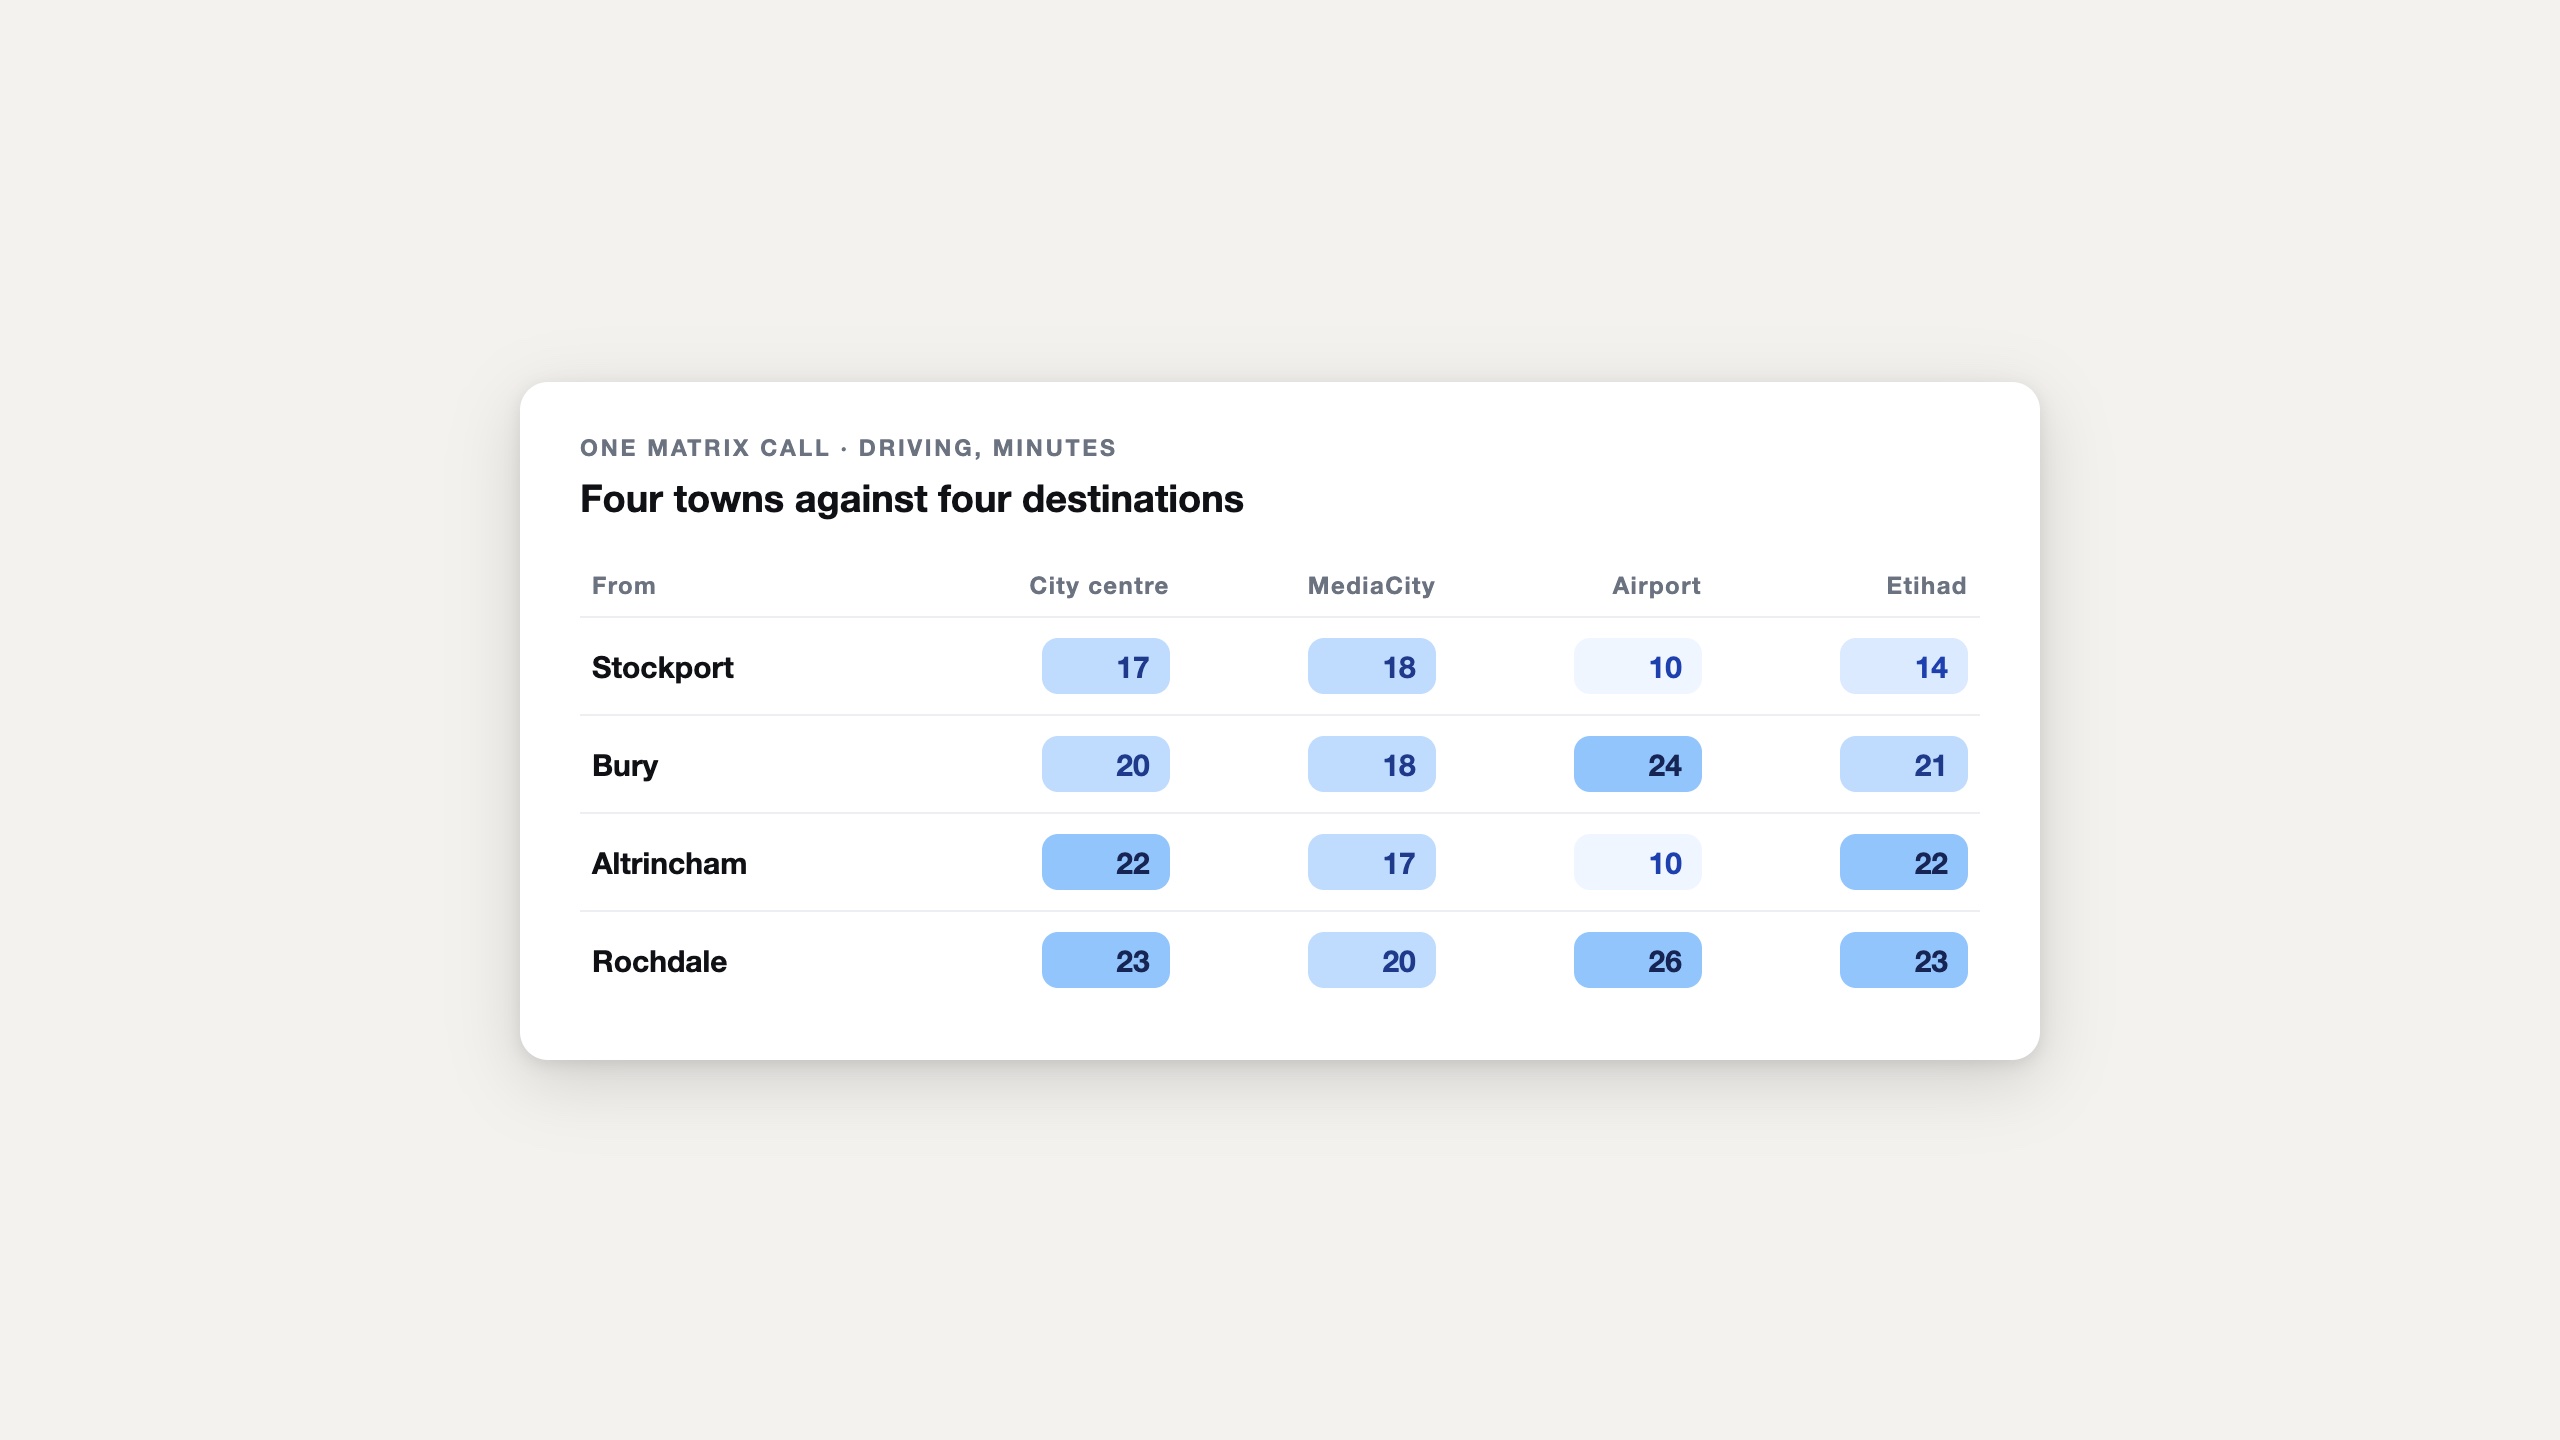
Travel time is the honest distance
Matrices score datasets by real travel time instead of crow-flies kilometres: territory design, catchment overlap, service equity.
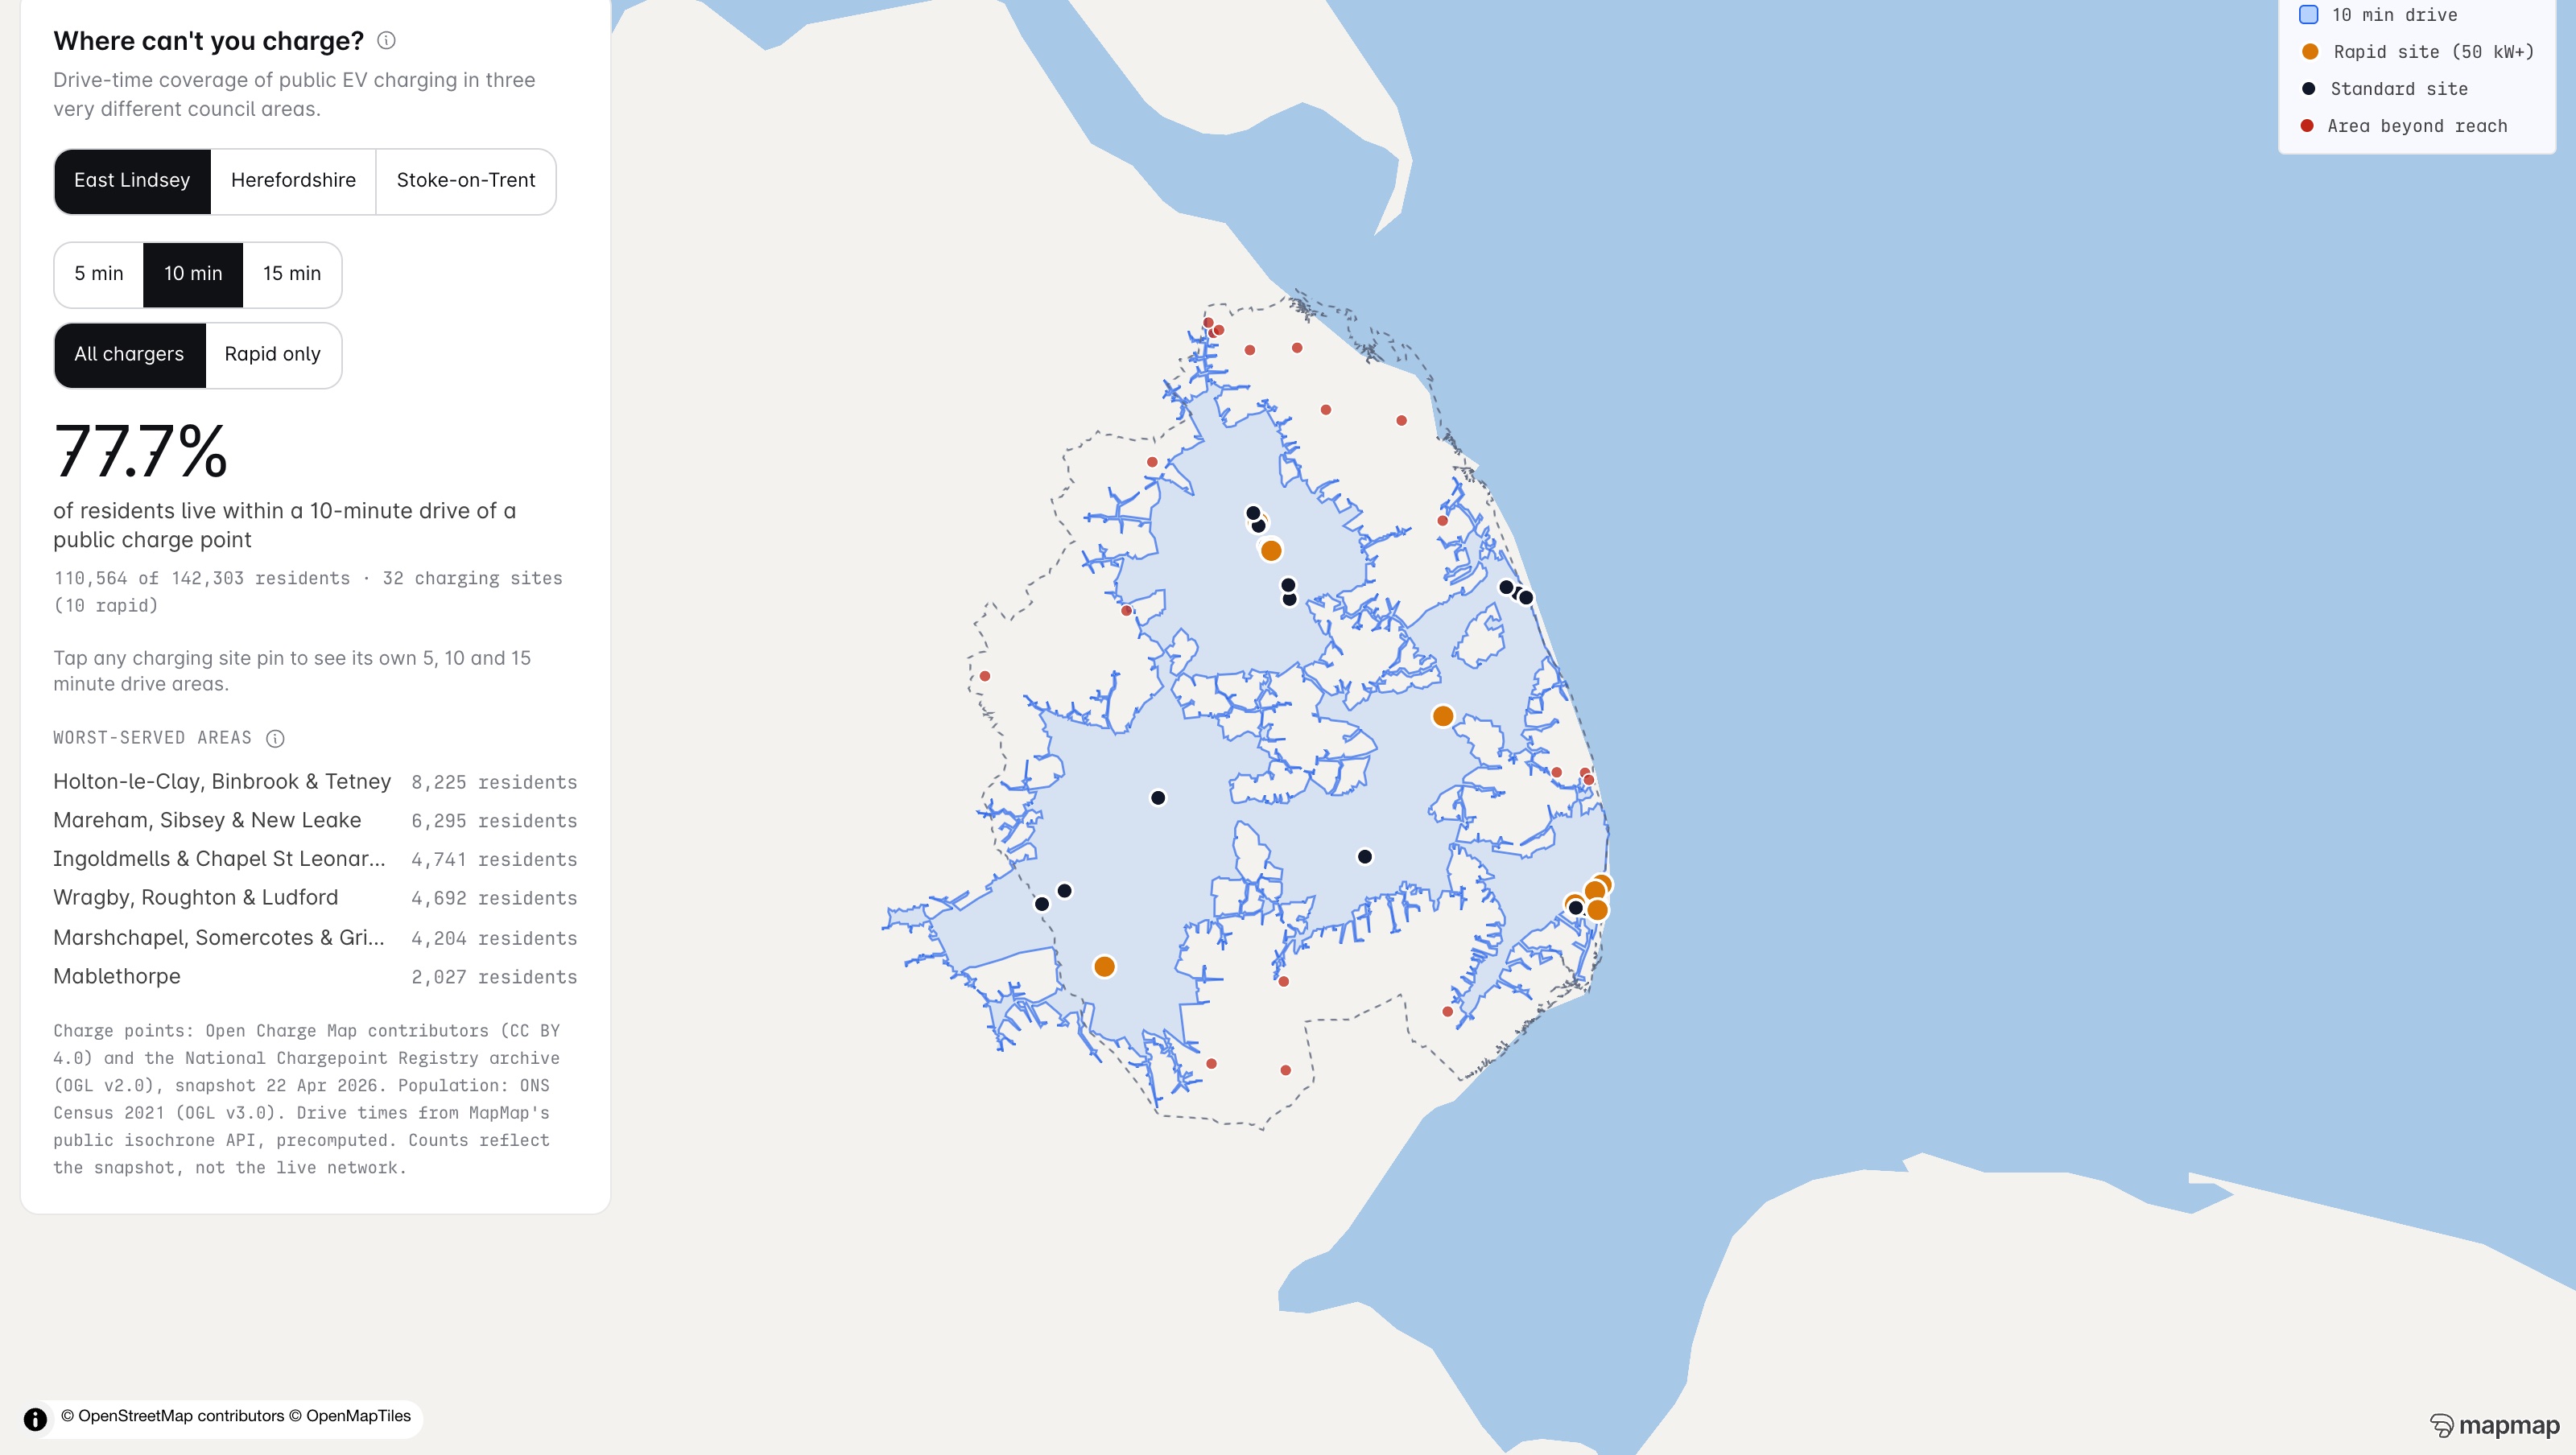
Isochrones for real catchments
Drive, cycle and walk-time polygons on the actual road network, ready to intersect with population or customer data.
See the study live →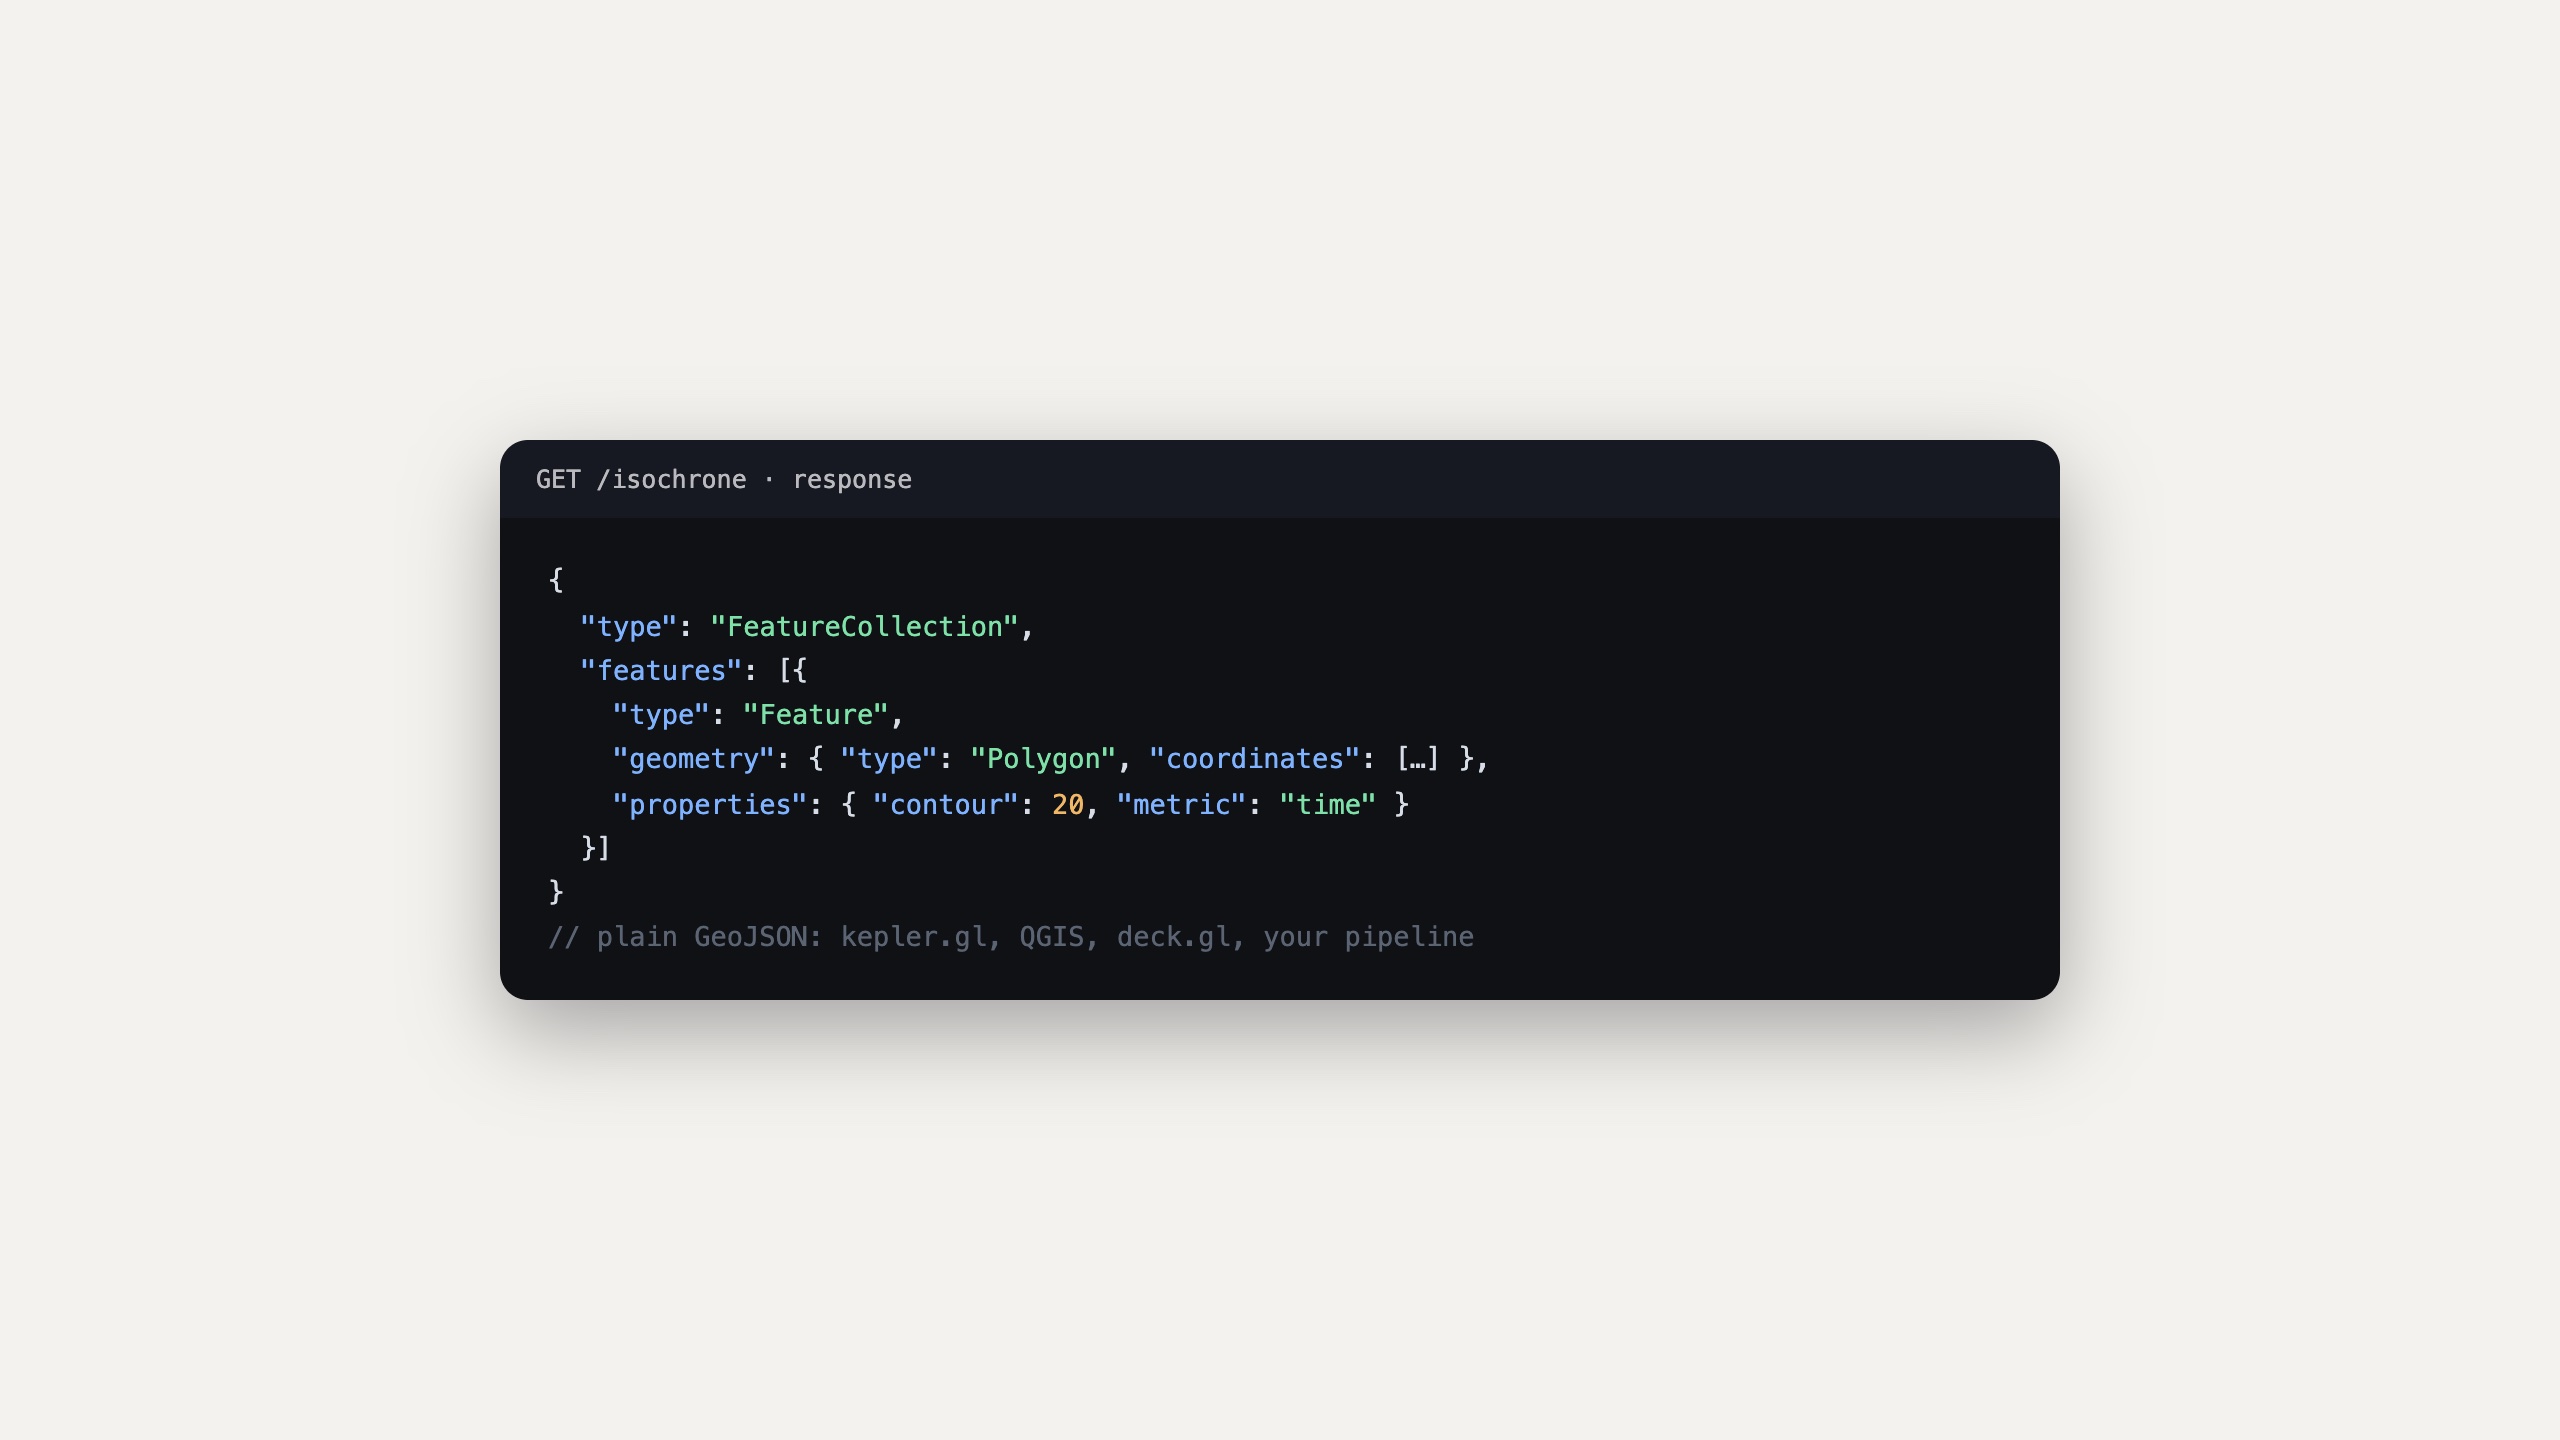
Straight into your GIS stack
Isochrones and route geometries come back as plain GeoJSON. OD matrices are numeric JSON arrays, row-major seconds and metres, with a CSV export shaped for kepler.gl, so results drop into the tools your analysts already run.
OD matrix guide →Your data never leaves the pipeline
Customer datasets should not transit a map vendor to get enriched. Docker distribution inside your own network: no egress, no per-call metering, an SBOM for the review.

Your analysts' agents can call all of it
The hosted MCP server exposes geocoding, matrices, isochrones and local geometry tools to AI agents, so the copilot in your notebook computes with the engine instead of estimating.
There is no administrative-boundary dataset or footfall data product; bring your own polygons and demographic data, as our public studies do with ONS and open registries.
Bring the dataset and the question.
The public coverage studies on this site were built exactly this way: geocoded, matrixed, mapped, exported to a GIS stack. Our AI agents will build yours.
What you are actually being offered.
On the page, not in the small print: the scope, the deliverable, the timetable and how the money works, before you spend an hour on a call finding out.
- Who it is for
- An analytics or BI team paying per call for location work that belongs in their own stack.
- What is in scope
- Bring the dataset and the question. We geocode it, matrix it, map it and export it into the GIS stack your analysts already run.
- What you get
- A working study on your data, with the isochrones and route geometries as GeoJSON and the OD matrix as numeric JSON with a CSV export shaped for kepler.gl.
- How long
- Days rather than months. The public coverage studies on this site were built exactly this way.
- What it costs
- Scoped on the call. Hosted calls are metered on the published rate card; a self-host licence removes the per-call meter entirely.
- Next step
- Bring the dataset and the question, and we will build the study and hand you the export.
Automotive
MapMap in the vehicle: a full navigation stack you host and control.
Trucking & Logistics
The router that refuses the bridges the map records, before your driver sees them, with dispatch-grade optimisation built in.
Fleet Optimisation & Dispatch
Plan the whole shift against skills, windows, capacities and rest, then follow it without handing anyone your drivers' positions.