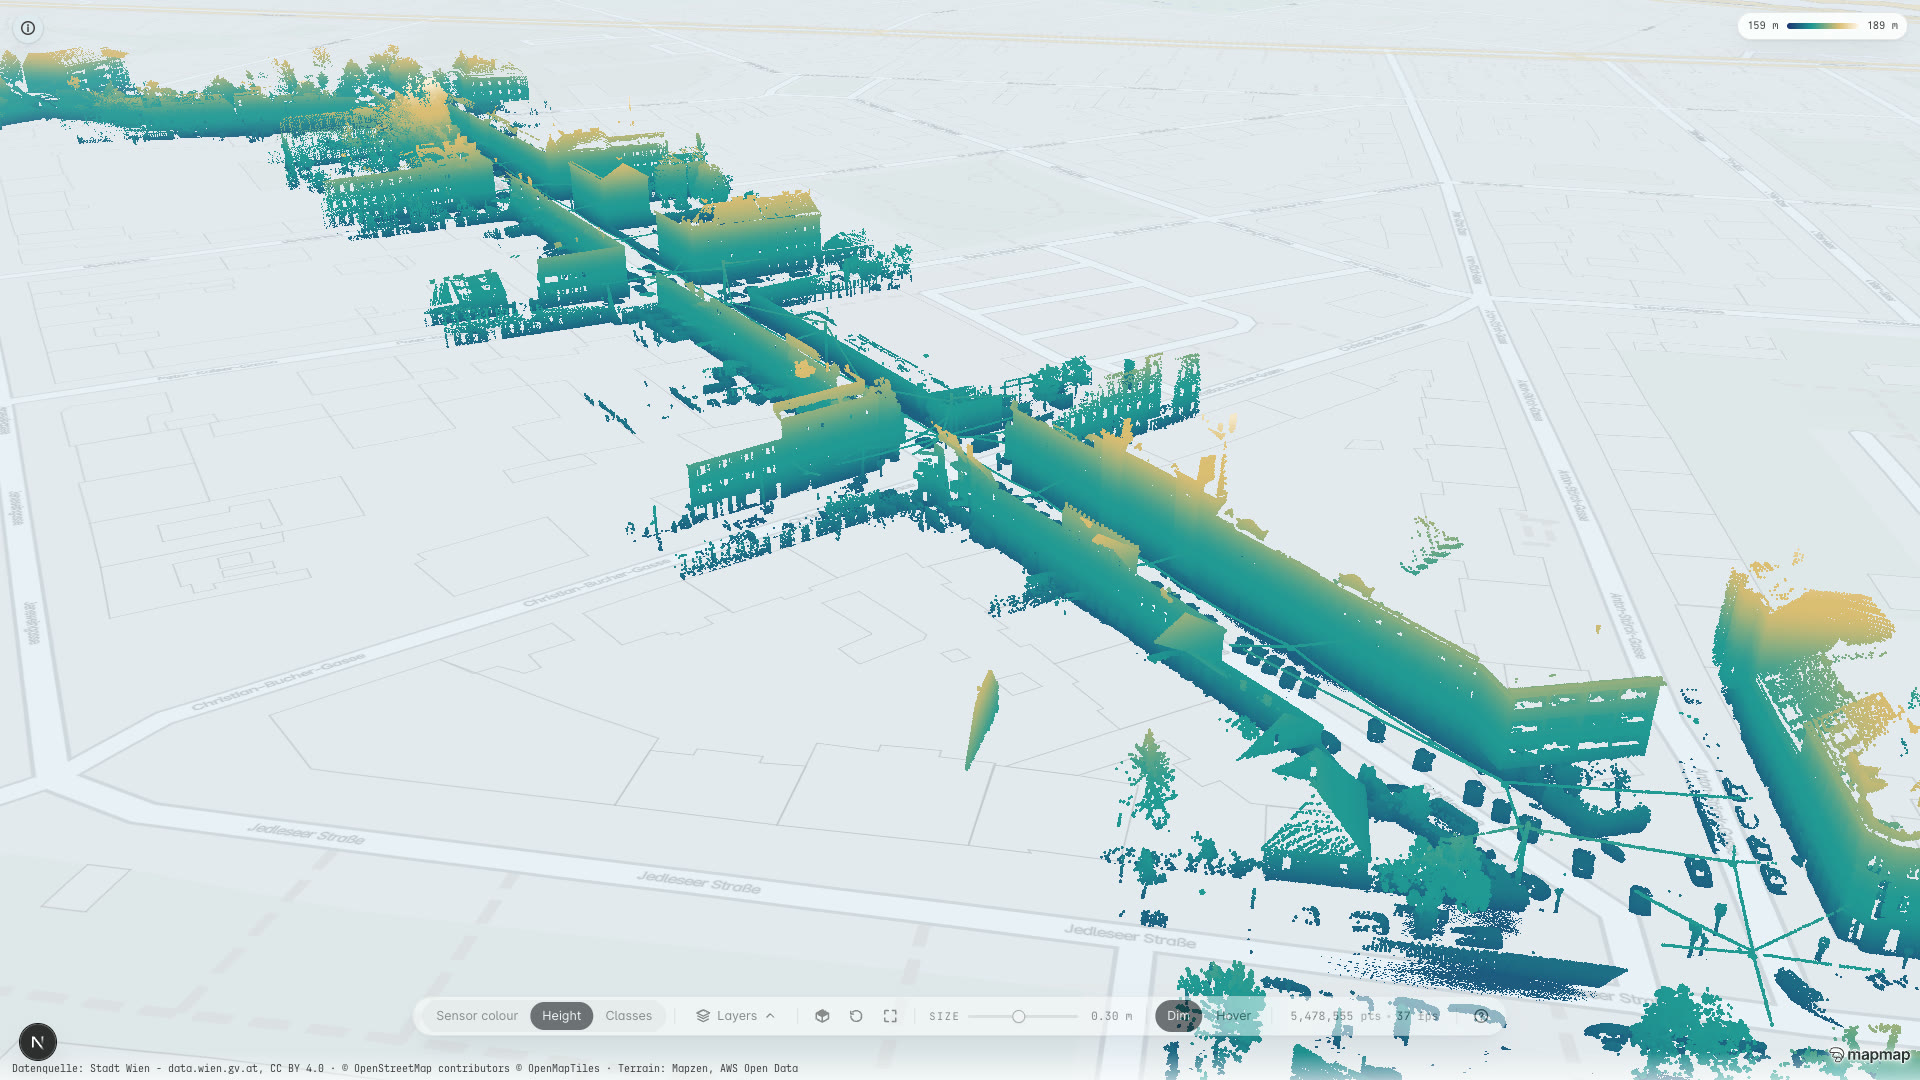
Your deliverable opens in a browser, on your own infrastructure.
@mapmap/points draws lidar and photogrammetry clouds inside the map's own WebGL context, so the cloud composites with the basemap, the terrain and every other layer instead of floating in a canvas over them. It reads your class table as written, so a 40 stays a 40, and it runs against a deployment you host, so looking at a cloud is not a metered event.
Point cloud: Stadt Wien - data.wien.gv.at, CC BY 4.0
A cloud on a real map, in a stack you run.
Everything below is shipped today: the renderer, the wire format, the class model and the self-hosted platform underneath them.
One draw call, composited with the basemap
The cloud is a MapLibre custom layer drawn in the map's own WebGL context: one buffer, one draw call, depth-correct against terrain, 3D buildings and every layer you already render. There is no second canvas over the map, and no second camera to keep in step with the first. Set terrainRelative when your heights are measured from a terrain surface and the layer reconstructs the camera from that surface rather than the z = 0 plane, which is the difference between correct point sizes in hilly country and an eye a hundred metres underground. Above: 3,602,663 points of the Pool of London, Tower Bridge and the City behind it, from the Environment Agency's National LIDAR Programme, on real terrain, at 60 frames a second. Contains Environment Agency data. © Environment Agency and database right. Open Government Licence v3.0.
A wire format sized for the network
Three Uint16 positions and four Uint8 bytes of colour, with the class riding in the alpha byte: 10 bytes a point against roughly 48 for the naive float encoding, which is the difference between a 10 MB and a 48 MB million-point corridor before compression. Both blocks reach the GPU untouched, as two typed-array views over the downloaded buffer, with no copy and no per-point loop.
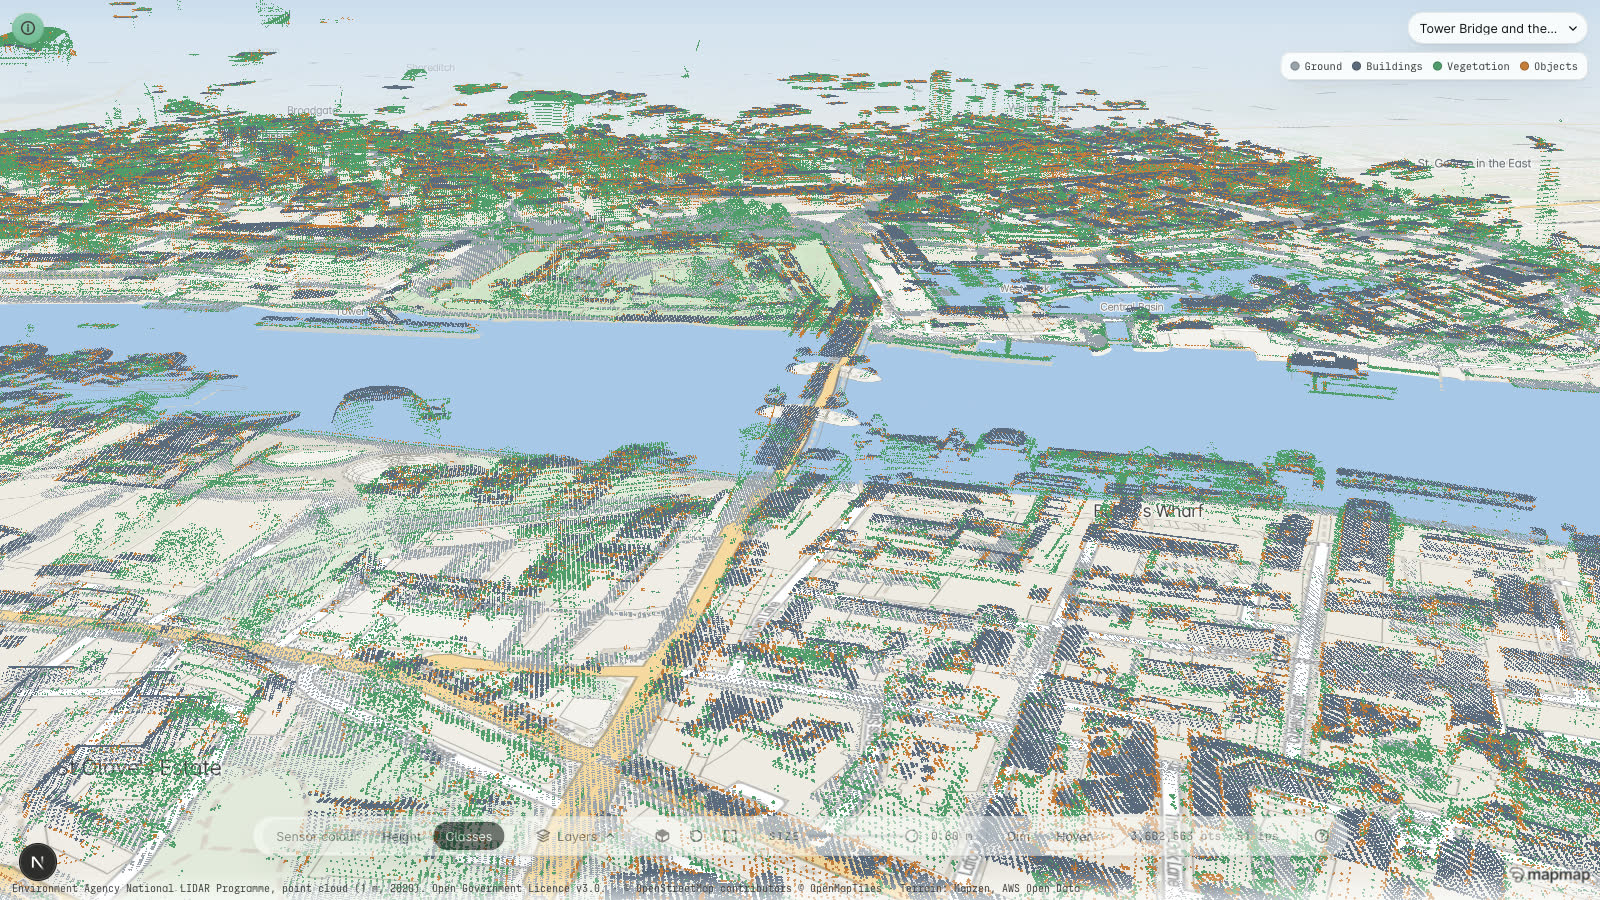
Your class bytes stay your class bytes
A survey vendor, a national mapping agency and an ASPRS LAS file number their classes differently, and a renderer with an opinion silently mislabels two of the three. The class table is an input here: pass values, labels and colours, and 40 stays 40 rather than being reindexed to 2. The shader is generated per table. Duplicate bytes, values outside 0 to 255 and tables over 16 classes throw at load rather than rendering points that quietly take a neighbour's colour. Above, the survey's own ASPRS classification drawn as itself: ground, buildings, vegetation and objects, with the key naming the four and the Layers control able to switch any of them off in any colour view.
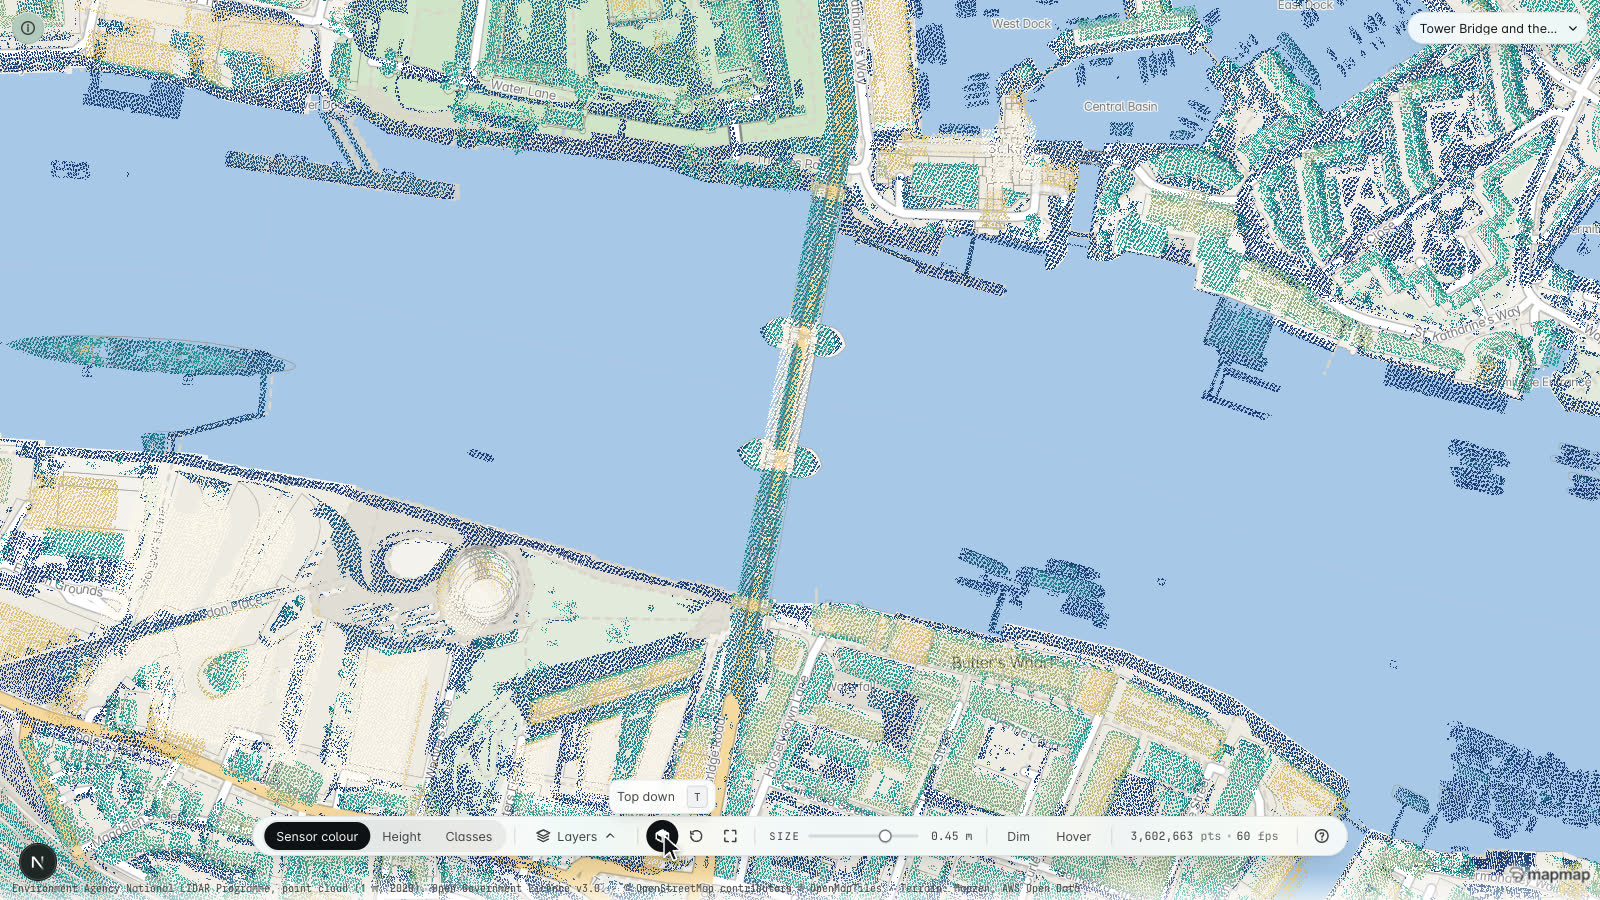
Next to routing, geocoding and isochrones
The cloud lands georeferenced on the same map as the road network, so the platform underneath it can answer questions about that network: route to the site, reverse-geocode a location, draw the reachable area. One deployment, one key, one basemap, rather than a viewer in one tab and a mapping stack in another. Above is the same scene straight down with the basemap at full strength: quaysides, dock edges and the bridge deck land on the ones the map draws.
The client opens your URL, not a vendor's
Docker distribution inside your own network: tiles, geocoding and routing on your infrastructure, and the cloud payload served from your own storage. Nothing meters per view, no client data crosses someone else's platform just to be looked at, and there is an SBOM and a security questionnaire ready for the review.
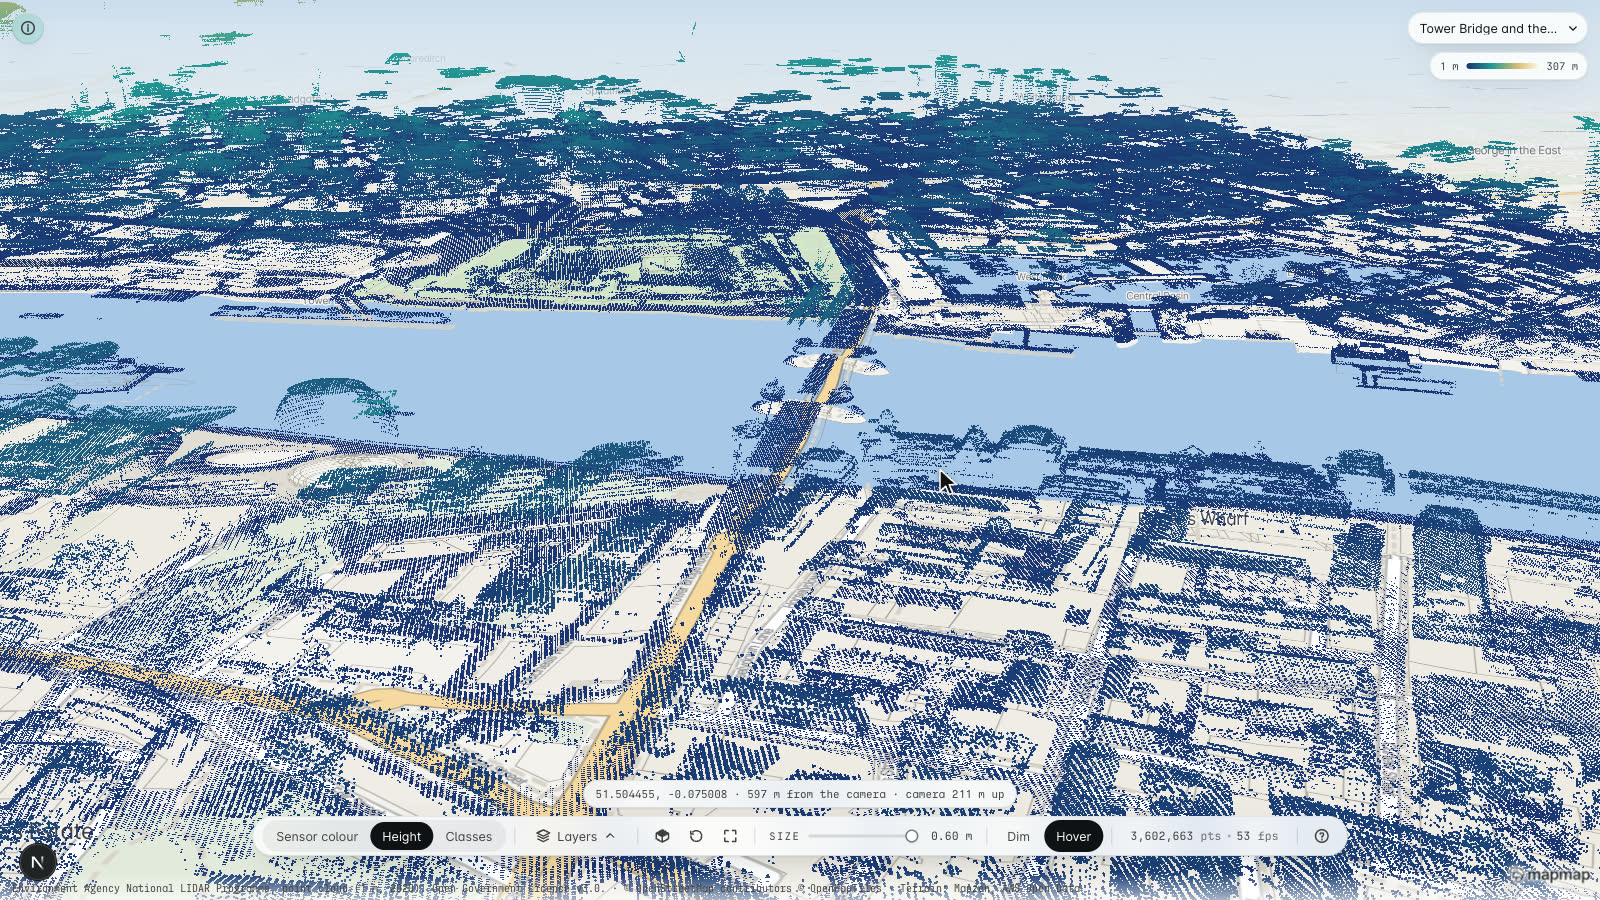
Check the CRS before you trust the position
A cloud in the wrong place is the most common way a first trial fails. The sidecar's anchor is trusted as lng/lat by design and never silently corrected, so validate_geodata and POST /geodata/validate are shipped endpoints you can call to check a dataset's declared CRS against its coordinates before you place it. Above: the viewer's own readout, which says where the pointer lands on the ground and how far away that is. It measures the ground plane rather than the point under the cursor, and the wording says so.
Ask the cloud whether the lorry fits
A router enforces the height restrictions the map records, and where a structure carries no tag it has nothing to act on, so it returns the road as passable. Hand the gateway a route shape and a vehicle instead and it walks that corridor over your survey's own geometry: pass, fail, or an honest refusal to answer, with the limiting point, the measured headroom, the bound on it and a link to that spot in the viewer. It is a measurement from a dated survey, never a signed or legal height, and never a pass over ground the survey did not cover.
How the measurement works →Known limits: this is a renderer, not a platform, and the two paths have different limits. The baked payload path is one buffer fetched whole with everything resident, which suits corridors and sites rather than a whole county in one layer; past a few million points, bake to COPC or split the area into several clouds and swap layers by viewport. It reprojects nothing: the sidecar anchor is trusted as lng/lat, so check a dataset's declared CRS before you bake it. The streaming path, openCopc, reads a COPC over HTTP range requests and traverses its octree each frame, so the file may be gigabytes, and it places the cloud from the file's own WKT record: geographic, Web Mercator, Transverse Mercator (every UTM zone, BNG, MTM) and Lambert Conformal Conic 2SP, with anything else refused by name unless you pass your own conversion. No datum shift is performed either way. One COPC per layer: multi-file mosaics and EPT sources are not in 0.5.0. There is no annotation, no access-controlled share link and no interactive measure tool in the SDK today. Clearance is measured server-side against a clearance field baked from the same survey, which is separate work from a payload bake and will not run at all without a declared vertical datum.
We will put your cloud on the map.
Send us a baked corridor or a site, or tell us what you capture, and our AI agents will stand up a working viewer on MapMap with your class table, your colours and your basemap, running on infrastructure you can point a client at. The same way we build MapMap itself. Bakes are a bespoke engagement rather than a subscription: a few days of professional services covering ingest, classification, georeferencing and the viewer, then the payload is yours to serve.
What you are actually being offered.
On the page, not in the small print: the scope, the deliverable, the timetable and how the money works, before you spend an hour on a call finding out.
- Who it is for
- A survey or reality-capture business whose deliverable currently needs desktop software to open.
- What is in scope
- Send a baked corridor or a site, or tell us what you capture. The engagement covers ingest, classification, georeferencing and the viewer; it is professional services, not a subscription.
- What you get
- A working viewer on your own infrastructure with your class table, your colours and your basemap, and the payload is yours to serve afterwards.
- How long
- A few days of professional services for a bake and a viewer, with the date agreed on the call.
- What it costs
- Scoped on the call. Bakes are a bespoke engagement rather than a subscription, and the clearance packages have published prices.
- Next step
- Send a corridor or a site, and we will put your cloud on the map and give you the link.
Automotive
MapMap in the vehicle: a full navigation stack you host and control.
Trucking & Logistics
The router that refuses the bridges the map records, before your driver sees them, with dispatch-grade optimisation built in.
Fleet Optimisation & Dispatch
Plan the whole shift against skills, windows, capacities and rest, then follow it without handing anyone your drivers' positions.